Month: September 2026

How Many Forex Pairs Should You Trade? Anywhere From 1 to 28

Search this question and you get the same answer everywhere. One to three pairs. Master them. Ignore the rest.

My answer is different, and it comes from how I actually trade.

Some days I trade one pair. Some days four. Some days I am working across all 28 majors and crosses. It changes constantly, and it depends on many variables.

That is not indecision. It is what happens when the number of pairs stops being the thing you worry about.

So let me give you a proper answer. Not a rule, but a way to think about it.

The Standard Advice (and Why It Exists)

Most educators tell beginners to stick to one to three pairs. It sounds sensible. Fewer charts, less confusion, more focus.

And for a trader using the usual retail toolkit, it is sensible. Here is why.

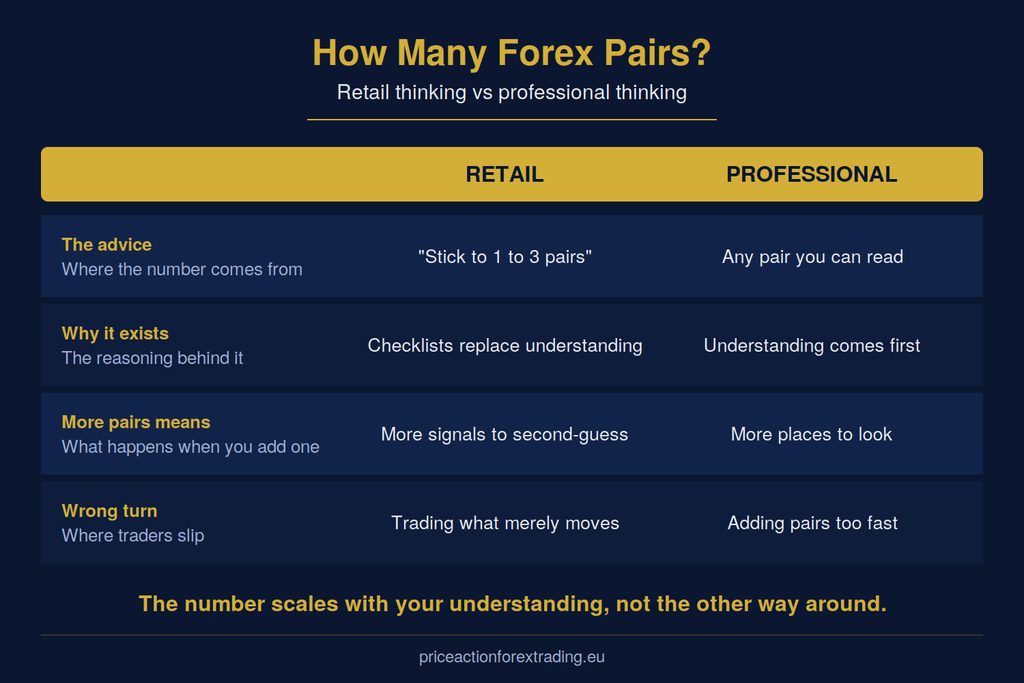
If your approach is built on indicators, memorised chart shapes and checklists in place of real understanding, every new pair is another chart you have to run all of that on. Another set of readings to interpret. Another pile of signals that may or may not agree with each other. Ten pairs means ten times the confusion.

So the advice to limit yourself is really a workaround. It manages the overwhelm that comes from not understanding what you are looking at.

That is worth pausing on. The “one to three pairs” rule does not tell you how many pairs the market allows you to trade. It tells you how many pairs a trader relying on checklists instead of understanding can keep track of before it falls apart.

Different problem. Different answer.

The Real Question Behind the Question

When someone asks “how many forex pairs should I trade,” what they usually mean is one of these:

  • How do I avoid being overwhelmed?
  • How do I avoid losing money on too many positions?
  • Will more pairs mean more opportunities?

All fair. But notice that none of them are about the number. They are about understanding.

Here is the contrast that matters:

A trader who reads the market like a retail trader will lose on one pair or on twenty-eight. Adding pairs just multiplies the same mistake.

A trader with genuine professional understanding can apply it to any chart, because it is the same market and the same kind of behaviour showing up in different places.

For a professional trader, all pairs are tradable. The number on any given day is simply where the opportunities are.
Why My Number Is Never the Same

People often want a fixed answer from me. “Tomas, how many pairs do you trade?”

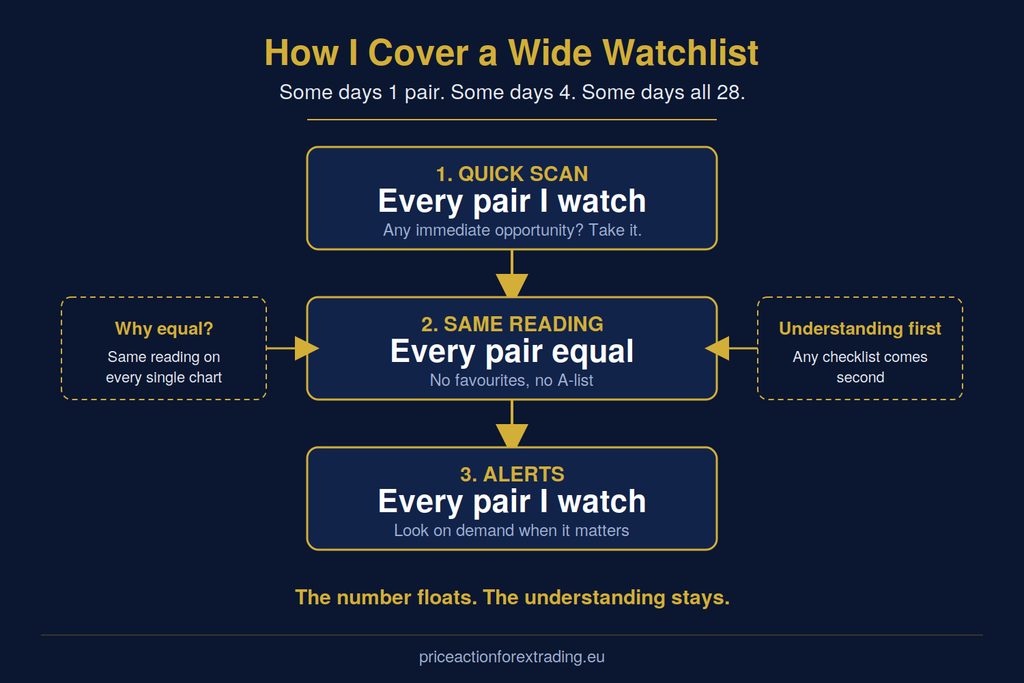
There is no fixed answer. On one day I might trade a single pair because that is where the opportunity is. On another, four. On a busy day, I can be trading across all 28.

I do not decide a number in the morning and then hunt for trades to fill it. That would be backwards. The market decides where the opportunities are, and I go where the reading takes me.

That is the difference between a plan built around pair count and one built around understanding.

  • Pair-count thinking: “I trade EUR/USD and GBP/USD, so I wait for those to do something”
  • Professional thinking: “I can read any pair, so I look wherever the market is offering something”

The first one leaves you idle for days and tempts you to force trades. The second one means you are never dependent on a single chart waking up.

How I Cover a Wide Watchlist

When I am watching many pairs, the process stays simple.

I open my charts and scan quickly for any immediate opportunity. If something is there, I take it. If not, I move on to my analysis.

And here is the part that matters: I treat every pair equally. No favourites, no “A-list” and “B-list”. The same reading applies to every chart, so there is no reason to give one pair a deeper look than another.

My charts stay open through the day, and I use alerts so I can look on demand when something interesting starts happening. That is just my convenience. It is not a rule, and it is not the edge. If you want to know how I think about screen time in general, I covered it in how often you should check forex charts.

So the structure is simple:

  • Quick scan: every pair I am watching, for immediate opportunities
  • Same reading on every pair: no pair gets special treatment
  • Alerts: to look on demand when something interesting is happening

Simple on purpose. Professional understanding comes first, and everything else is secondary to it.
Majors, Minors and Crosses: Do They Matter?

Beginners get told a lot about pair categories. Majors are liquid, minors are trickier, exotics are dangerous. Much of it is repeated without much thought.

Here is what I would say from experience.

I treat every pair equally. Major, minor or cross, the reading is the same. No pair is off limits when you genuinely understand what you are looking at.

What does differ is who is trading it. Some pairs have more retail traders than others. That is a real difference, and it is worth knowing about. Once you can read the market properly, it is one more thing you are aware of, not a reason to avoid a pair.

There is also the practical side: spread, liquidity and how a pair behaves at different times. Around the daily rollover, I tracked spreads on several brokers and saw them jump from close to zero to around 12 pips on majors and around 30 pips on minors. Different pairs have different personalities, and it pays to know them.

What Actually Goes Wrong When You Add Pairs Too Early

I am not saying you should open twenty-eight charts tomorrow. There is a real way to get this wrong.

The mistake is not “too many pairs.” The mistake is adding pairs faster than your understanding grows.

Here is what that looks like:

  • You open a new pair because it is moving, not because you can read it
  • You trade it with a different logic than the pairs you know
  • You end up with several open trades and no clear reason for any of them
  • One bad day feels like five, because everything went wrong at once

None of that is caused by the pair count. It is caused by trading things you do not understand.

And notice the flip side. A trader who sticks to a single pair but does not really understand what is happening will still lose. They just lose slowly and with fewer charts.

Fewer pairs does not fix a lack of understanding. It just hides it for a while.

Why “More Pairs = More Opportunities” Is Only Half True

The other common belief is the opposite: more pairs means more setups, so more money.

Partly. More pairs gives you more places to look. But an opportunity only counts if you can recognise it.

If you cannot read a pair properly, a hundred charts will not create a single real opportunity. You will just generate more things to second-guess.

If you can read pairs properly, then yes, more pairs means you are less dependent on any single chart doing something. You are not waiting around for one market to wake up.

Opportunity is not created by the number of charts. It is created by the number of charts you can read with confidence. That is the only number that matters.

So How Do You Decide Your Number?

Here is the approach I would give someone starting out today. Not as rules, just as a way to think.

Start with what you can read

Pick the pairs where you feel you understand what price is doing. If that is one pair, fine. If it is six, also fine. Your comfort with a pair should come from understanding it, not from having stared at it for a long time.

Add a pair when you can explain it

Before adding a new pair, ask yourself a simple question: can I explain what is happening on this chart in the same terms I use for the pairs I already trade?

If yes, add it. If no, you are not adding a pair, you are adding a lottery ticket.

Go where the opportunity is

Do not marry a pair. Once you can read many charts, the goal is not to trade “your” pairs. It is to trade wherever the market is offering something.

Count your exposure honestly

This one is just arithmetic. If you have three open trades and they all involve the same currency, you effectively have a bigger position on that currency than it looks like at a glance. Know what you are actually holding.

Let your number float

Your number is not fixed. It moves with the market and with your understanding. There is no finish line where you are “allowed” to trade more pairs. It just happens as you get better at reading.

What About Time?

A common worry is that more pairs means more hours at the screen. It does not have to. A structured scan, the same reading applied to every pair, and alerts to look on demand is a workflow that fits around a normal life. I break down what a working day looks like in how many hours a day forex traders trade.

The time you spend is not tied to the pair count in a straight line. It is tied to how efficiently you read each chart. Someone who understands what they are looking at can process a chart in seconds. Someone who does not can stare at one chart for an hour and come away with nothing.

That is another reason understanding comes first. It is what makes a bigger watchlist manageable.

Where the Timeframe Fits In

If you trade several pairs, your choice of timeframe matters more than it would with a single pair. It gives your scan a consistent structure, so every chart is read the same way.

I go into how I approach this in the best timeframe for price action forex trading. Higher timeframes carry more weight because more capital moves through the key reversal levels visible there. That is true on every pair, which is why the same timeframe logic applies across my whole watchlist.

Consistency here is what lets a big watchlist feel calm instead of chaotic.

The Professional Angle

Here is the bigger idea behind all of this.

Retail education treats forex like a menu. Pick a pair, pick an indicator, pick a strategy, and hope the combination works. In that world, the number of pairs is a menu decision, and limiting it is a way of limiting mistakes.

Professional understanding works differently. You are reading the behaviour of the market participants behind the price, and that behaviour shows up across pairs. It is not a different game on each chart. It is the same game in different places.

I will not go into the details of how that reading works here, because it is the part I only teach through training. But the practical result is what I have described above: when you understand what you are looking at, the number of pairs stops being a source of anxiety. It becomes a choice about where you want to look.

And when Professional Alignment is present, meaning the different pieces of the picture line up at a key reversal level, it does not matter whether the pair is the first on your list or the twenty-eighth. The read is the read.

The Short Version

  • The “one to three pairs” advice exists because retail methods do not scale, not because the market limits you
  • For a professional trader, all pairs are tradable
  • My own number changes constantly: sometimes 1, sometimes 4, sometimes 28
  • The number of pairs is a result of your understanding, not a cause of your success
  • Add a pair only when you can read it in the same terms as the ones you already trade
  • Count your exposure by currency, not just by number of trades

Ready to Build Real Understanding?

If you want to stop guessing at questions like “how many pairs” and start reading the market properly, that is exactly what I teach.

The Forex Training Course works for new and experienced traders alike, and it is where I go into the professional reading I have only touched on here. If you would rather begin with one complete strategy and get moving fast, Learn to Trade in 5 Days gives you a full standalone way to trade with professional understanding.

Either way, the number of pairs will sort itself out.

Thanks for reading and have a beautiful day!
How Often Should You Check Forex Charts? (However Often You Want)

“How often should I check the charts?

Every hour? Twice a day? Only at candle close? Never on weekends?

Traders ask me this constantly, and they are usually hoping for a rule. Something clean they can follow so they feel like they are doing it right.

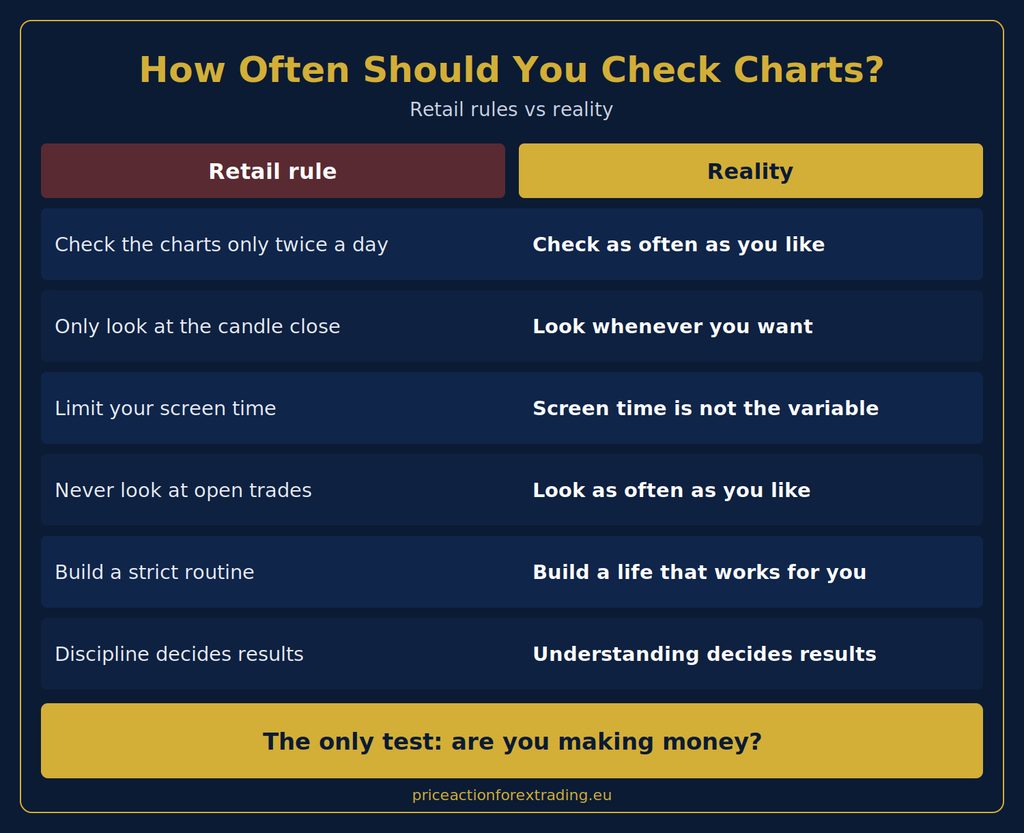
Here is my answer, and it will disappoint anyone selling a schedule: check the charts as many times as you want.

Once an hour, fifty times a day, or once a week. There is no correct number. If you are making money, your frequency is good. If you are not, changing the frequency will not fix it.

In this article I’ll explain why the whole question is built on a retail fantasy, where the fantasy comes from, and what you should be focused on instead.

The Answer Nobody Selling a Schedule Wants to Give

Type this question into a search engine and you will find the same advice repeated everywhere.

Check twice a day. Set alerts and walk away. Only look at the close of the candle. Limit your screen time. Never touch your open trades.

It all sounds reasonable. It sounds disciplined. And that is exactly why it spreads.

But ask yourself where these rules come from. They come from people who do not have a real answer to why traders lose, so they pick something measurable and blame that. Too much screen time. Too many looks. Not enough structure.

It is easy to count how often someone checks a chart. It is hard to teach someone to read what is on it. So the industry teaches the easy thing.

Where the Frequency Obsession Comes From

Retail trading education runs on rules and checklists. Rules are easy to write down, easy to sell, and easy to feel good about following.

When a trader loses, the retail explanation is always about behaviour:

  • “You overtrade.”
  • “You lack discipline.”
  • “You watch the screen too much.”
  • “You need a stricter routine.”

Notice what is missing. Nobody asks whether the trader actually understands what the market is doing. Nobody asks whether the decisions were sound in the first place.

So the trader adopts a schedule, checks the chart at exactly the approved times, and loses anyway. Then they are told the schedule needs to be stricter.

That loop can run for years. I have watched people go through it.

If you want to see how this plays out in a bigger picture, I wrote about what actually separates results in is price action trading profitable. Behaviour rules are nowhere near the top of the list.

What Decides Your Results

Let me put it as simply as I can.

Take two traders. Both look at the same chart. One looks once. The other looks five hundred times.

If neither of them understands what they are looking at, it makes no difference. They will both lose, one slowly and one faster.

If both of them genuinely understand what price is doing and why, it also makes no difference. They will both make money. One of them just spent more time on the couch.

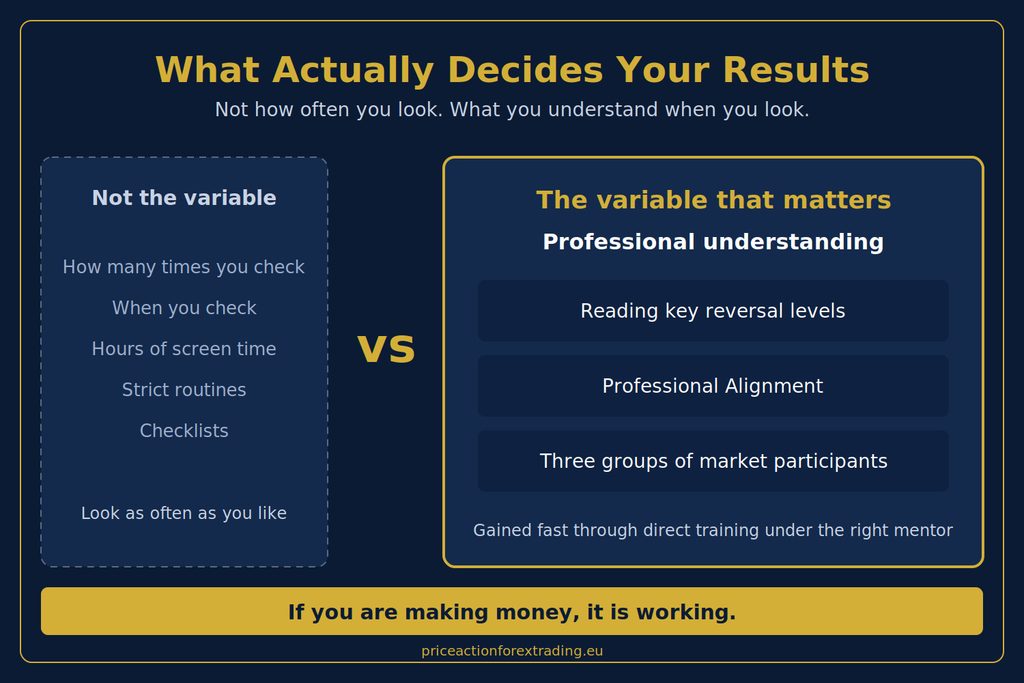
The number of looks is not the variable. What you understand when you look is the variable.

This is why I don’t treat a schedule as the answer. A schedule changes when you look. It does nothing about what you see.

Same Chart, Different Reader

Here is another way to think about it.

Imagine handing a page of a foreign language to someone who cannot read it. You can tell them to look at it twice a day, or once an hour, or only at sunrise. They will get exactly nothing from it either way.

Now hand the same page to someone who reads that language fluently. They can glance at it for two seconds or study it all afternoon, and they will understand it.

A chart works the same way. To someone who can read it, every detail carries meaning. To someone who cannot, more time just means more staring.

That is why I never say most of a chart is unimportant, and why I never tell people to look at it less. The question is not how much you look. It is whether you can read.

If You Are Making Money, It Is Working

This is the test I use, and I think it is the only honest one.

Are you making money? Then how you check your charts is fine. Keep doing it.

Do you check constantly and make money? Good. Do you check twice a day and make money? Also good. Nobody gets to tell you your method of looking is wrong when your results say otherwise.

Are you not making money? Then look at what is happening in the trades themselves. Why you entered, what you understood at that location, whether you were reading price with professional knowledge or with a public toolkit.

The frequency of your screen time is almost never the answer. It is just the most convenient thing for retail educators to point at.

How I Do It

I do check the charts on a repeated schedule. It’s a routine that fits my life and I’m comfortable with it.

On top of that, I use alerts. When something interesting is going on, I look on demand, whenever it happens, without waiting for the next scheduled check.

So I use both. Neither one is a rule, and neither one is the reason I make money. I start my top-down read on H1 and H4 (I go through how in my H1 forex trading strategy article), and my results depend on what I understand when I look, not on when or how I got there.

If a schedule suits you, use one. If alerts suit you, use those. Mix them like I do, or throw both away. The routine is a convenience. It’s not the edge.

If you are curious about the other side of this question, how long a trading day actually takes, I covered that in how many hours a day forex traders trade. The short version is the same: the clock is not where the edge is.

Retail Advice on Checking Charts You Can Ignore

Let me go through the most common rules and say why I’d drop each one.

“Only check at the close of a candle”

You can look whenever you like. A candle that is still forming still carries information, and a trader who can read price gets something from it. Waiting for a close is a rule made for people who do not trust their own read.

“Check only twice a day”

If you are trading H1 and H4 and you are happy with two looks, fine. If you want twelve, also fine. There is nothing magic about two.

“Set alerts and walk away”

I use alerts myself, so I’m not against them. They are a handy tool for looking on demand when something interesting is going on. But they are not a requirement, and they are certainly not the secret to good trading. Use them if they make your life easier. Skip them if they don’t.

“Limit your screen time”

Some traders love the chart and enjoy every hour with it. Others get their work done and close the laptop. Both are fine. Screen time is not a measure of anything.

“Never look at your open trades”

Look at them as often as you like. Looking at a trade does not change it, and it does not make you a worse trader. Whether you manage it well depends on your understanding, not on how disciplined your eyes are.

“Build a strict trading routine”

Build a life that works for you and trade around it. I check on a repeated schedule myself, so I have nothing against routines. They are just not a strategy, and they are not what makes the money.

Does Your Style Change Anything?

Not really.

A trader working the H1 and H4 charts and someone trading a lower timeframe will probably end up with different looking days. That’s natural. But it is a result of what they are doing, not a rule they need to follow.

Scalping is worth a quick note because it is so often misunderstood. Scalping is defined by a tight profit target, not by how long the trade stays open. A scalp can remain open for days if price has not reached the target yet. So the idea that scalpers must stare at the screen while everyone else can relax is just another retail myth.

Whatever your style, the principle holds. Look when you want. Trade what you understand.

What About a Day Job?

This is where the frequency myth does the most damage.

Plenty of people believe they cannot trade because they cannot watch the market all day. So they either give up, or they try to trade from a phone at their desk and feel guilty about it.

You do not need to be at the screen constantly. You also do not need to feel bad if you can only look a few times a day. What you need is understanding, so that when you do look, you know what you’re looking at.

There is one more thing worth saying. A professional strategy works at any time of day. What changes across the day is liquidity, not validity. So whatever window your life gives you, it can work.

What You Should Be Focused On Instead

If not frequency, then what?

Professional understanding of what price is doing at key reversal levels.

That is where results come from. Not from a schedule, not from discipline, and not from a checklist.

The market is driven by three groups of market participants, and genuinely understanding how they behave is what separates people who make money from people who don’t. It is not something you will find on YouTube or in forums, and it is missing from most private courses too. It is what I was trained in directly by my mentor, and it is what I teach.

When price reaches a key reversal level, the question is whether Professional Alignment is there. That is a question of understanding. Not of how often you looked, or when.

Volume, for the record, is only confirmation of a level you have already read professionally. It is never the reason to trade.

Understanding Is Faster Than You Think

Most people assume that learning to read the market takes years of screen time. That is exactly the retail belief that keeps people stuck: more hours, more charts, more backtesting.

Under the right mentor, it does not work like that. You can be trained directly, you can see the difference quickly, and the improvement can come fast. Hours at the chart were never the missing ingredient. Knowledge was.

That is what my mentor Robert Taylor gave me, and it is why I do not tell traders to look at the chart less, or more, or on a timetable. I tell them to learn to read it.

Final Thoughts

So, how often should you check forex charts?

However often you want.

Check them a hundred times or twice. Check at candle close or in the middle of it. Look at your open trades every minute if you feel like it. If you are making money, it is working. If you are not, the number of looks is not the problem, and no schedule will fix it.

Put your effort where it counts: learning to read price with genuine professional understanding.

If you want to build that understanding, my Forex Training Course shows exactly how I read key reversal levels and Professional Alignment, and it suits new and experienced traders alike. If you’d like something focused to start with, Learn to Trade in 5 Days is a complete, standalone course that can have you trading profitably on its own.

Thanks for reading and have a beautiful day!
How Many Hours a Day Do Forex Traders Trade?

New traders ask me this question constantly: how many hours a day do forex traders actually trade? They expect a number. Six hours. Eight hours. Maybe “as long as London and New York overlap.” I understand why. It feels like a measurable, controllable variable in a business that otherwise feels chaotic.

But after years of trading full time, I can tell you the honest answer isn’t a number of hours at all. It’s a question of what you’re doing with the time you spend at the chart, and that distinction is exactly where retail traders and professionals part ways.

In this article I’ll walk through why “hours traded” is the wrong metric, what actually determines how much time a session takes, and what a realistic day looks like when you’re trading with genuine professional understanding instead of chasing candles.

Why “Hours Traded” Is the Wrong Question

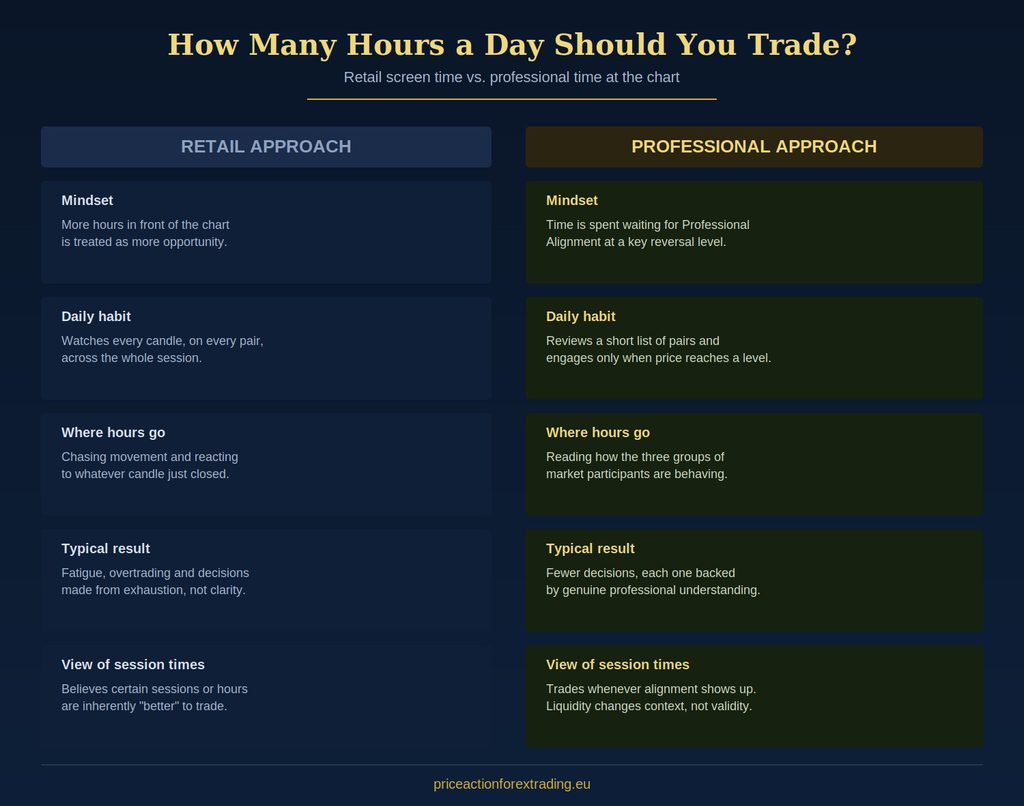
Screen time feels productive. If you’ve spent six hours watching charts, it’s tempting to believe you’ve done six hours of “work” as a trader. But watching price move and reading price move are two completely different activities, and only one of them produces decisions worth acting on.

Retail traders tend to treat every hour at the chart as equally valuable. More hours means more chances to catch a move, so the logic goes. That mindset is what leads people to sit through entire sessions, watching every candle on every pair, waiting for something – anything – to happen.

Professionals don’t operate this way. Most of a trading day is spent waiting for price to reach a key reversal level where Professional Alignment can actually be read. The chart can sit quietly for long stretches, and that’s not wasted time. It’s price building toward a location that matters. The number of hours you’re technically “at the chart” tells you almost nothing about whether that time was well spent.

There Is No Universal Number

If you ask ten profitable traders how many hours a day they trade, you’ll get ten different answers, and all ten can be legitimate. The honest range runs from under an hour to most of a working day, and the variation comes down to a handful of factors rather than a rule anyone should copy blindly.

Your Strategy Shapes Your Time Commitment

A trader working the H1 chart checks in periodically through the day rather than staring at the screen continuously. Because I start my own top-down read on H1 and H4, a lot of my process involves marking levels, stepping away, and returning when price is closer to somewhere worth paying attention to. That’s a very different time footprint than someone trying to catch every five-minute swing.

It’s also worth clearing up a common misunderstanding about scalping here, since it comes up constantly around this topic. Scalping isn’t defined by short holding times, it’s defined by a tight profit target. A scalp trade can sit open for a day or more if price hasn’t reached that target yet. So “I scalp, therefore I only need thirty minutes a day” is a myth built on a misunderstanding of what scalping actually is. If that’s a strategy you’re considering, it’s worth understanding properly rather than picking up the label from a forum post.

Market Conditions on a Given Day

Some days, price reaches meaningful levels quickly and decisively. Other days it grinds sideways for hours before anything worth reading develops. You can’t schedule genuine opportunity in advance. Some sessions require more patience than others, and pretending otherwise is how traders end up forcing entries just to justify the time they’ve already spent watching.

How Many Pairs You’re Following

Watching one pair closely takes far less total time than trying to track eight pairs simultaneously across multiple timeframes. Most professional traders narrow their focus rather than widen it. A shorter watchlist, reviewed properly, produces better decisions than a long one skimmed under pressure.

What a Realistic Trading Day Actually Looks Like

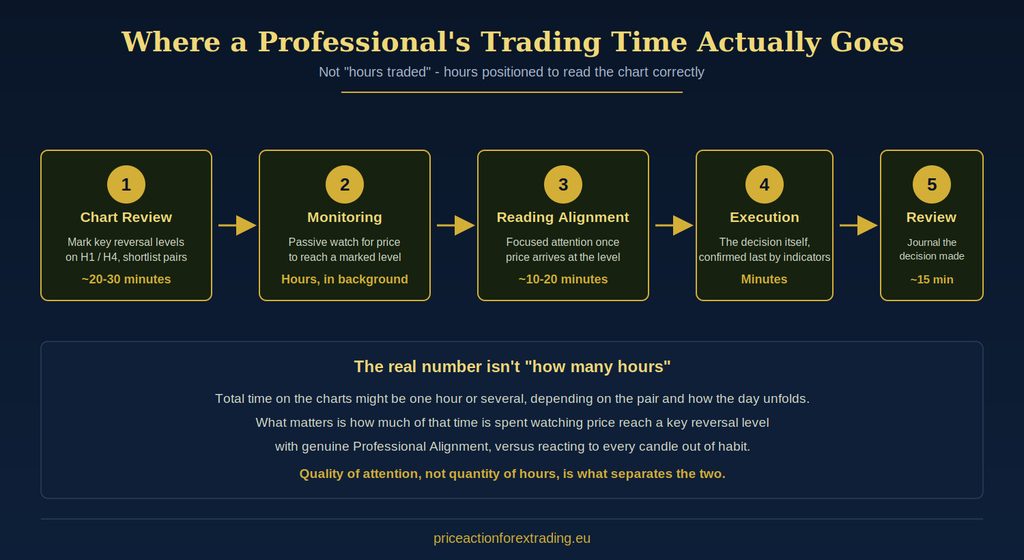
Here’s roughly how time breaks down on a normal trading day for me, and it might look different from what you’d expect if you’ve been picturing eight straight hours of chart-watching.

Chart review and level marking takes maybe twenty to thirty minutes. This is where I go through my shortlist, mark key reversal levels on H1 and H4, and get a sense of which pairs are worth watching that day.

Monitoring is the largest chunk of time by the clock, but it’s mostly passive. Price needs time to travel toward a level, and there’s no benefit to staring at that process candle by candle. This is the stretch retail traders spend glued to the screen and professionals spend doing almost anything else, checking back periodically rather than continuously.

Reading alignment happens once price actually reaches a level worth reading. This is where focused attention matters, and it might take ten to twenty minutes of genuine, undistracted concentration on what the three groups of market participants are doing at that specific location on the chart.

Execution itself is quick. By the time indicators confirm what the level reading has already suggested, the decision takes minutes, not hours. As I’ve written elsewhere, indicators are the last piece of the process, not the starting point, and the actual edge comes from understanding retail indicator behavior, not from avoiding indicators altogether.

Review at the end of the session, journaling what happened and why, takes another fifteen minutes or so.

Add it up and the “active” time – the part where real decisions get made – is a small fraction of the total day. That’s not a flaw in the process. It’s the entire point.

Why More Screen Time Doesn’t Mean More Profit

I’ve mentored enough traders to see this pattern repeat itself: the trader spending the most hours at the chart is frequently the one struggling the most, not the one performing best. It seems backwards until you understand what’s actually happening.

More hours at the chart, without a professional framework for reading price, just means more exposure to impulsive decisions. Every extra hour spent watching without a genuine reason to act is another hour where boredom, frustration, or FOMO can talk you into a trade you shouldn’t take. I’ve covered this dynamic in more depth in is price action trading profitable, and the short version is that profitability tracks the quality of your decisions, not the quantity of hours behind them.

This is also where the checklist mentality does real damage. Traders who think success comes from mechanical discipline – trade this many hours, check the chart this often, follow this rulebook – are optimizing for the wrong variable entirely. What actually separates outcomes is professional thinking applied with professional knowledge at the moment a level is reached. That’s not something more hours can substitute for.

Does Time of Day or Session Matter?

This question usually comes bundled with “how many hours,” so it’s worth addressing directly. A lot of retail material insists certain sessions – London open, the New York overlap – are inherently better times to trade. I’d push back on that framing.

A professional strategy works at any time of day. What changes across sessions is liquidity, not validity. A key reversal level doesn’t stop being meaningful because it’s being read during the Asian session instead of London. What does shift is how much volume is moving through that level, and volume matters only as confirmation of a read that’s already been made, never as a standalone signal to trade off. If you’ve marked a level correctly and price arrives at it with genuine alignment, the clock on the wall isn’t the deciding factor.

This ties into a closely related misunderstanding worth clearing up too – the idea that higher timeframes are somehow “cleaner.” They’re not cleaner. They simply carry more weight, because more capital moves through the levels visible there.

What About Hours Per Week?

The daily question usually leads to a follow-up: if daily hours vary this much, what does a realistic week look like? Here again, there’s no single number that fits everyone, but a few patterns hold up consistently among traders who are actually profitable.

Most professional-style traders check the market five to six days a week, since the forex market itself runs from Sunday evening through Friday close across global sessions. But “checking the market” and “actively trading” aren’t the same commitment. On a given week, a trader might see genuine, tradeable alignment on only two or three pairs across the entire week, and skip everything else without a second thought.

This is a hard concept for newer traders to accept, because it runs against the instinct that more activity equals more progress. In reality, a week where you sat on your hands for four days and took one well-read trade on the fifth can be a far stronger week than one where you took a dozen mediocre entries just to feel productive. Weekly consistency comes from consistently applying the same standard to every level you look at, not from filling a weekly hours quota.

If you’re building a trading schedule around a day job, this is genuinely good news. You don’t need to replicate a full-time trader’s total screen time to develop the same skill. You need the same quality of attention during the windows you do have available, applied consistently over time.

Building the Habits That Matter More Than the Hours

If you’re new to this and still trying to figure out how much time to budget for trading each day, I’d gently suggest you’re asking the wrong first question. The number of hours you spend will sort itself out naturally once you understand what you’re actually looking for on the chart. Until then, more hours just means more time spent looking in the wrong places.

This is exactly the trap I address in how to learn forex trading without wasting years. Most traders assume competence is purely a function of time invested – years of screen time, thousands of chart hours, endless backtesting. Under the right mentor, that timeline compresses dramatically. Genuine professional understanding isn’t something you accumulate slowly through sheer repetition. It’s something you can be trained in directly, and once you have it, your relationship with time at the chart changes completely.

That’s really the shift I want every reader to take from this article. Stop measuring your trading in hours. Start measuring it in the quality of what you’re doing with the time you have. A trader who spends forty-five focused minutes a day reading key reversal levels with genuine Professional Alignment will outperform someone glued to five screens for ten hours, every time.

Building a Schedule That Actually Works for You

Once the framework is right, the practical question becomes how to structure your day around it. A few things I’d suggest:

  • Narrow your watchlist. Following two or three pairs properly beats half-watching eight.
  • Set specific check-in windows around when your marked levels are realistically likely to be approached, rather than sitting through the entire session.
  • Treat the “waiting” portion of your day as legitimate work, not dead time. It’s part of the process, not a gap in it.
  • Keep a journal of what actually happened at each level you tracked, whether or not you traded it. This builds the pattern recognition that makes future reads faster.
  • Resist the urge to add hours when a strategy isn’t performing. The fix is almost never more screen time.

None of this requires a rigid schedule locked to specific clock hours. It requires knowing what you’re looking for, so the hours you do spend are doing something.

Final Thoughts

So, how many hours a day do forex traders trade? The professional ones spend as long as it takes to review the chart, wait for price to reach somewhere meaningful, and read what’s happening there with genuine understanding – sometimes under an hour of real decision-making inside a longer window of patient watching. There’s no fixed number worth chasing, and any answer that gives you one is oversimplifying a process that’s really about attention and understanding, not the clock.

If you want to build that understanding properly rather than guessing your way through it, my Forex Training Course walks through exactly how I read key reversal levels and Professional Alignment, or if you’d rather get moving faster, Learn to Trade in 5 Days is a complete, standalone course that can have you trading profitably on its own.

Thanks for reading and have a beautiful day!
H1 Forex Trading Strategy: How I Actually Trade the One-Hour Chart

If you’ve searched for an “H1 forex trading strategy,” you’ve probably already read a dozen articles telling you the one-hour chart is the sweet spot for swing traders because it’s “cleaner” than the lower timeframes and less noisy than the daily. I want to tell you why that explanation is wrong, and what actually makes H1 worth your attention.

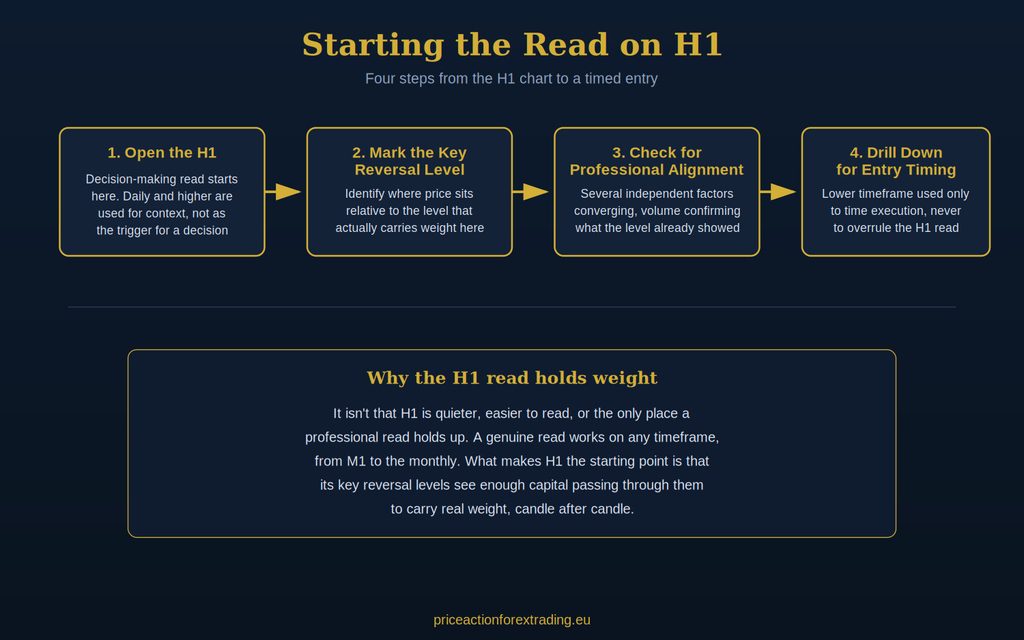
I start my own top-down read on H1 or H4, and that’s where the decision-making actually happens. That choice isn’t about comfort, personal preference, or believing a professional read only becomes reliable once you reach an hourly chart. A genuine professional read holds up on any timeframe, from M1 to the monthly. I want to walk you through exactly why H1 is where I choose to start, and what that means in practice.

Where H1 Fits in a Top-Down Read

Most trading education tells you to start with the daily chart to “get the big picture,” then work your way down. I do look at the daily chart, and higher, for that bigger picture context. There’s nothing wrong with using them that way, and I wouldn’t skip them.

But the daily chart isn’t where my actual read, the one that leads to a decision, begins. That read starts on H1 or H4. Not because higher timeframes skip over meaningful information, and not because a professional read is somehow more reliable up there than it is on M1 or M15. Every candle on every timeframe carries something meaningful. There’s no such thing as a timeframe that’s “full of noise” you can safely ignore, and no such thing as a timeframe that’s inherently “cleaner” either. That framing gets repeated so often in retail trading content that people accept it without questioning it, but it doesn’t hold up once you understand what’s actually happening at each level.

What makes H1 (and H4) genuinely useful as a starting point is simpler than “less noise”: more capital moves through the key reversal levels that show up on these charts. That’s the entire reason the read carries weight there. It has nothing to do with the chart being easier to look at.

This matters because if you believe H1 is valuable because it’s “quieter,” you’ll treat the 5-minute chart as worthless, and you’ll miss what’s actually happening at your entry. If you understand H1 is valuable because of where capital is concentrated, you use it correctly: as your starting point for identifying the levels that matter, not as your only source of information.

If you’re still building your foundation in what price action in forex actually is, that’s worth reading before you go further with any specific timeframe strategy, since everything below builds on it.

Where H4 Fits Alongside H1

I mention H4 alongside H1 because the two work together, not as separate strategies competing for your attention. H4 often shows me a key reversal level forming with more weight behind it, simply because even more capital has passed through it by the time that candle closes. H1 gives me a more frequent read of the same kind of level, which means more opportunities to catch a professional setup as it develops rather than waiting hours for the H4 candle to close. Neither timeframe replaces the other. I move between them depending on how a level is developing, but the read itself, the actual question I’m asking about where price sits relative to that level, stays exactly the same regardless of which of the two I’m looking at in that moment.

What I’m Actually Looking For on the H1 Chart

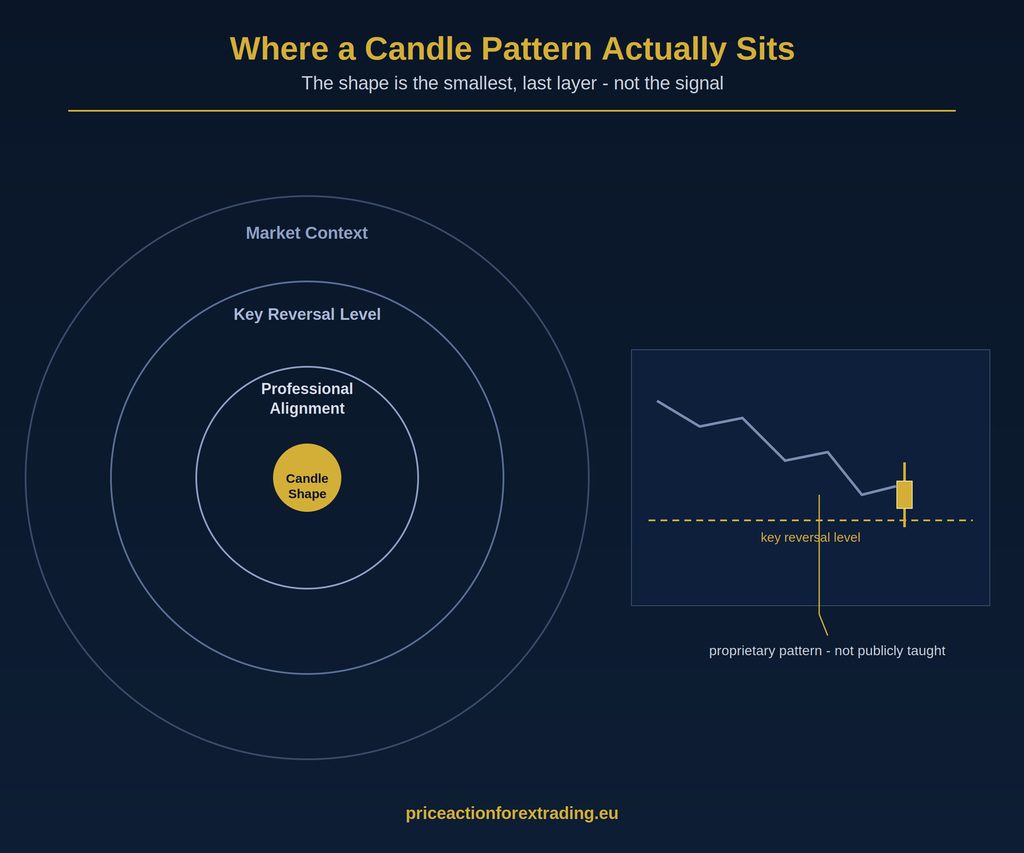
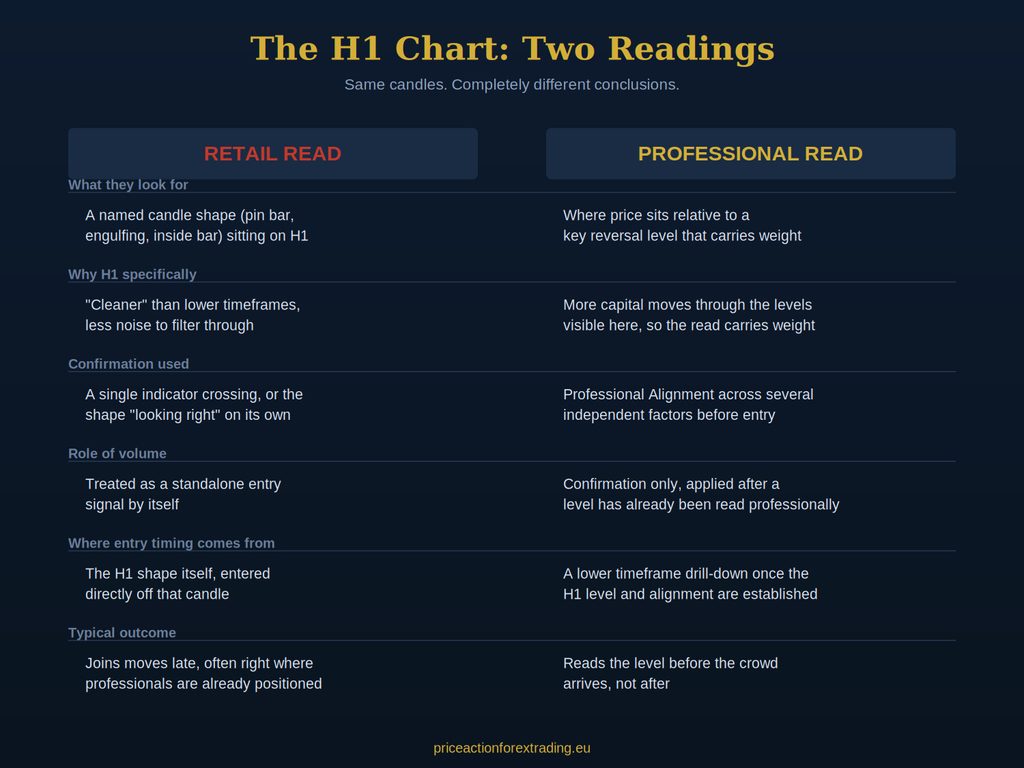
When I open an H1 chart, I’m not scanning for a named candle shape. I’m not looking for a pin bar, an engulfing candle, or an inside bar and treating that shape as my signal to enter. I don’t trade off any publicly named, retail pattern at all. The patterns I actually trade were developed through direct training with my mentor and aren’t something I teach publicly, in this article or anywhere else on the site. They’re reserved for people going through the training course, where they work with me directly.

What I am looking for on H1 is where price sits relative to a key reversal level. These are the levels where the three groups of market participants who move this market tend to act, and understanding their behaviour at these specific points is the actual edge, not the shape of any individual candle sitting on top of them.

This is a different question from “does the market have higher highs and higher lows right now.” I don’t gate whether a level is worth trading on trend structure. A key reversal level can be worth reading whether price is trending, ranging, or somewhere in between. If you’ve been taught to check for confirmed trend structure before you’ll even consider a level, that’s retail-checklist thinking, and it will cause you to sit out setups that are genuinely readable. I’ve written more on this in my piece on how to identify trend in forex, which covers why trend confirmation isn’t the gatekeeper most traders assume it is.

Professional Alignment: Why One Signal Is Never Enough

Once I’ve identified where price sits relative to a key reversal level on H1, the next question is whether there’s Professional Alignment: multiple independent factors converging at that same point, not a single trigger firing in isolation.

This is one of the biggest gaps between how retail traders use the H1 chart and how it actually gets used. A retail approach usually looks like this: spot a shape, check one indicator, take the trade. That’s a single point of confirmation, and it’s exactly the kind of decision-making that leaves a trader entering late, right around the point where professionals are already positioned and starting to take profit.

Professional Alignment means I’m not relying on any one thing. I’m reading how price has behaved into the level, what that tells me about the groups involved, and whether several things line up before I treat the level as tradeable. Volume plays a role here too, but only as confirmation of a read I’ve already made. It never operates as a standalone signal on its own. If volume is the only thing you’re looking at to justify a trade, you’re using it the way retail traders do, as a decision trigger rather than as backup for a decision you’ve already reached through genuine understanding of the level.

Indicators Have a Place, Just Not the Place You’ve Been Told

I do use indicators. That surprises people, because so much retail content around price action trading frames indicators as the enemy, something a “real” price action trader avoids entirely. I don’t avoid them. But they’re the least important part of my decision process, applied only after the H1 level has already been read professionally.

Here’s what actually differentiates a professional use of indicators from a retail one, and it isn’t simply “avoiding indicator-based entries.” Plenty of retail traders also try to avoid pure indicator entries, so that alone wouldn’t set anyone apart. What matters is understanding how retail traders commonly use popular indicators, and what decisions they typically make based on those readings. That knowledge of retail behaviour around indicators is itself valuable information, and it’s something I factor into my own decisions at the level. I go into this in more depth in price action vs indicators in forex, if you want the fuller picture of how that actually works.

So when I do glance at an indicator on H1, I’m not using it to decide whether to enter. I’ve already made that decision based on the level and the alignment around it. The indicator, if I use one at all, is the last piece applied on top, not the trigger that starts the process.

Drilling Down for Entry Timing, Without Overruling H1

Once a key reversal level on H1 has genuine Professional Alignment behind it, I’ll often drop to a lower timeframe to time the actual entry more precisely. This is where a lot of traders get confused about what “multi-timeframe analysis” is supposed to mean.

The lower timeframe doesn’t get a vote on whether the trade is valid. It doesn’t overrule what I’ve already read on H1. Its only job is to help me time the execution once the decision has already been made. If you’re using a lower timeframe to second-guess or re-validate what H1 already told you, you’ve inverted the relationship between the two, and you’ll end up hesitating on setups you should have already taken, or worse, talking yourself out of good reads because a 5-minute candle looked unconvincing in isolation.

Common Mistakes Traders Make with H1 Strategies

A few patterns show up repeatedly with traders who come to me after trying to build an H1 strategy on their own. Most of these aren’t a lack of effort. They come from following widely repeated retail advice that sounds reasonable on the surface but doesn’t reflect how the H1 chart actually behaves at a key reversal level. Here’s what I see most often.

Treating the daily chart as the required starting point. Waiting for daily confirmation before acting on an H1 setup causes traders to miss levels while they’re still tradeable. By the time the daily chart “confirms” anything, the professional opportunity at that level has often already played out.

Chasing breakouts and retests as if they’re a professional method. I don’t trade breakout-and-retest setups, and I’ve written about why I don’t trade it and what I do instead when price moves through a key reversal level on H1. It’s predictable retail crowd behaviour, and reading it is useful, but not the way most retail content teaches you to use it.

Calling a move a “false breakout” and moving on. There’s no such thing as a false breakout in the sense most retail traders mean it. What gets labelled that way is a readable event to someone who genuinely understands what happened at the level, not some unpredictable market quirk. Reacting to a “failed breakout” after the fact, rather than reading the level beforehand, is a symptom of the same retail-checklist thinking that shows up everywhere else on this list.

Restricting H1 setups to certain sessions. I don’t limit valid H1 setups to London or New York open. A professional read works at any time of day. What changes across sessions is liquidity context, not whether the strategy itself is valid.

Expecting slow, incremental progress. A lot of trading education leans on the idea that improvement has to be gradual, that you should be patient through plateaus and losses because progress “isn’t linear.” I don’t subscribe to that framing. Under the right training, results and understanding can come quickly, sometimes within a single session. If you’re stuck rereading the same H1 chart without a shift in how you see it, that’s usually a sign you need direct training from someone who can show you what you’re actually missing, rather than more time spent alone with a chart.

Building This Into a Full Strategy

Everything above describes how I read the H1 chart, but reading a level correctly is only part of a complete trading process. The decision-making and execution stage, applying professional thinking with professional knowledge at the moment it matters, is the part that actually separates results, far more than any checklist or mechanical rule set could.

If reading key reversal levels on H1 with genuine Professional Alignment is new to you, my Forex Training Course walks through the full framework behind everything in this article, built for both new and experienced traders. And if you want to see this approach taught end-to-end using a single strategy you can start trading with immediately, Learn to Trade in 5 Days is a complete, standalone course built around exactly that.

Final Thoughts

The H1 chart isn’t valuable because it filters out noise. It’s valuable because of where capital concentrates around key reversal levels, and because a genuine read of participant behaviour at those levels holds up, candle after candle, in a way that chasing named shapes never will. Start there, look for alignment rather than a single trigger, use lower timeframes to time your entry rather than to second-guess your read, and you’ll find the H1 chart tells you a great deal more than most retail content gives it credit for.

Thanks for reading and have a beautiful day!
Best Timeframe for Price Action Forex Trading

If you’ve spent any time searching for the “best timeframe for price action forex,” you’ve probably found a dozen different answers. Some traders swear by the 15-minute chart. Others say the daily is the only chart worth looking at. Scalpers will tell you the 1-minute chart is where the real action happens.

I want to save you the years I spent chasing that question the wrong way. There is no single timeframe that will fix your trading. The timeframe you use matters far less than what you’re actually reading on it – and that’s the part almost nobody talks about.

In this article I’ll walk you through how I actually think about timeframes, why the “best timeframe” question is framed wrong from the start, and how to pick a chart (or charts) that fit the way you want to trade.

Why “Best Timeframe” Is the Wrong Question

Every retail trader eventually goes through the same phase. You start on the 5-minute chart because it feels exciting. Then you get chopped up by a string of losses, so you move to the 15-minute. Still not working, so you try the hourly. Then someone online tells you the daily chart is where “the smart money” trades, so you switch again.

None of these switches fix anything, because the problem was never the timeframe. The problem is what you’re looking for on the chart. Price action isn’t a chart setting you can dial in – it’s a way of reading what price is actually doing at a given moment, and that reading either holds up or it doesn’t, regardless of which timeframe you’re staring at.

A key reversal level on the 4-hour chart is still a key reversal level when you zoom into the 15-minute chart. What changes is the resolution you’re viewing it at, not whether it’s meaningful. Retail traders treat timeframes like separate universes with separate rules. Professionals treat them as different zoom levels on the same map.

What a Timeframe Actually Changes (and What It Doesn’t)

Zooming in or out doesn’t change the market. It changes how much detail you see between two points in time. The daily chart compresses a week of price movement into five candles. The 1-minute chart stretches that same movement across hundreds of candles.

What stays constant is the structure. A key reversal level that price respects on the daily chart didn’t appear because of the daily chart – it exists because of how the three groups of market participants are actually behaving at that price. Zooming in only lets you see the finer detail of how price approaches that same level.

This is exactly why chasing a “best timeframe” misses the point. You’re not looking for a timeframe that magically produces winning signals. You’re looking for a resolution that lets you see the read you’re already making with enough precision to act on it.

Higher Timeframes: What They’re Actually Good For

H1 and H4 are where I always start. Not because “higher timeframe is always better,” but because this is where the most significant key reversal levels tend to be visible, and where a professional read of the current situation actually holds weight.

Here’s what higher timeframes are genuinely useful for:

  • Context. Before I even think about an entry, I need to know where price sits relative to the levels that actually matter. That picture only comes from H1 and H4.
  • More weight behind the reaction. Higher timeframes aren’t “cleaner” or less cluttered than lower ones – every candle carries real information regardless of the chart you’re on. What makes H1 and H4 matter more is that more money is actually moving through the key reversal levels visible there, which is what gives the reaction at those levels more weight when price finally reaches them.

None of this means H1 or H4 alone gives you a complete trading plan. It gives you the frame everything else has to fit inside. If you want a broader look at how I read where price is actually heading before I ever think about timing, I’ve written about that in how to identify trend in forex.

Lower Timeframes: Where Precision Comes From

Lower timeframes – the 15-minute, 5-minute, and 1-minute charts – are not where I decide what to trade. They’re where I decide exactly when.

Once a key reversal level has been read on a higher timeframe and I have genuine reason to expect price to react there, the lower timeframe lets me watch that reaction unfold in detail. I can see price approach the level with far more resolution than the 4-hour chart would ever show me.

This is the piece most retail traders get backwards. They treat the lower timeframe as its own independent strategy – a separate chart with its own signals, its own indicators, its own decisions made in isolation from anything happening above it. That’s how you end up taking a “signal” on the 5-minute chart that runs directly against what’s actually happening on the daily chart.

Used correctly, the lower timeframe doesn’t generate the decision. It refines the timing of a decision that was already made further up.

Multi-Timeframe Alignment: How I Actually Approach It

This is the part that actually matters, and it’s the part almost nobody teaches properly. I don’t pick “a timeframe.” I read several timeframes together, and I only act when what I’m seeing lines up across them – what I call Professional Alignment.

Here’s roughly how that process works in practice:

  1. Start on H1 or H4. I identify the key reversal levels that are genuinely significant right now, and I form a professional read of where price is actually likely to go.
  2. Move down to a middle timeframe. This narrows the picture. I’m watching how price is behaving as it approaches the level I identified above, without yet making any decision.
  3. Drop to a lower timeframe for timing. Only once the level is close, and only once the read from the higher timeframes is intact, does the lower timeframe come into play – purely to time entry with precision.

Indicators can be part of that last step, but only as the final confirmation applied after the level has already been read professionally. Reading what retail traders typically see on those same indicators, and what decisions they typically make from that reading, is itself valuable information that feeds into how I approach the level – a subject I go into in more depth in price action vs indicators in forex.

Professionals aren’t infallible in this process. Sometimes price behaves in a way that even a genuine professional read didn’t fully anticipate. What’s far more common, though, is retail traders joining a move after professionals have already positioned themselves – not the other way around. That’s part of why the higher timeframe read has to come first: it’s the only way to have any real sense of who’s likely already positioned before you commit.

Timeframe and Trading Style: Scalping, Day Trading, Swing Trading

Your trading style genuinely does influence which timeframes you’ll spend the most time on, even though the underlying process of reading key reversal levels and waiting for Professional Alignment stays the same.

Scalping isn’t defined by the clock the way most retail content presents it. I don’t measure a scalp by how many minutes it stays open – I measure it by the target. A scalp is built around a tight, specific profit target, and if price takes its time getting there, the trade can stay open for days rather than closing in minutes. What makes it a scalp is the size of the move you’re aiming to capture, not the duration. Entries are still timed on the 5-minute and 1-minute charts, with the levels identified on H1 or H4 first. Scalping isn’t a shortcut around reading price properly – if anything, it demands faster, more precise reads because there’s less room for error. I cover this in detail in Learn to Scalp in 5 Days, which walks through exactly how that timing process works.

Day trading typically means working across the 15-minute to 1-hour range, closing positions before the day ends. This gives you slightly more breathing room than scalping while still requiring you to be actively watching the market.

Swing trading stretches out to the 4-hour and daily charts, holding trades for days rather than hours. This suits traders who can’t sit in front of a screen all day, since the structure develops more slowly and doesn’t demand constant attention.

None of these styles is inherently “better.” They suit different lifestyles and different amounts of available screen time. What doesn’t change between them is the underlying skill: reading key reversal levels professionally and waiting for genuine alignment before acting. A professional approach isn’t restricted to particular hours or sessions either – the process works at any time of day, though liquidity naturally shifts depending on which markets are active.

Common Mistakes Retail Traders Make With Timeframes

I made most of these mistakes myself early on, so I recognize them instantly when I see other traders making them.

  • Timeframe shopping. Switching charts until you find one that “agrees” with the trade you already wanted to take. This isn’t analysis, it’s confirmation bias wearing a different chart.
  • Ignoring the higher timeframe entirely. Trading purely off a 5-minute chart without any sense of where the bigger picture stands is one of the fastest ways to get caught trading directly against the real direction of the market.
  • Treating the lower timeframe as a separate system. As I mentioned above, the lower timeframe chart isn’t where decisions get made – it’s where they get timed.
  • Expecting a timeframe to compensate for a lack of genuine understanding. No chart resolution replaces an actual professional read of key reversal levels. If the foundational skill isn’t there yet, changing timeframes just changes what the mistake looks like.

If any of this sounds familiar, it’s worth reading how to learn forex trading without wasting years on the wrong things, since timeframe hopping is usually a symptom of a bigger gap rather than the actual problem.

How to Choose Your Timeframe

Rather than asking “what’s the best timeframe,” ask yourself these questions instead:

  • How much time can I realistically dedicate to watching a screen? If it’s limited, swing trading on higher timeframes will suit you far better than scalping.
  • What pace do I actually enjoy? Some traders find the pace of the daily chart frustrating. Others find scalping stressful. Trading in a style that fights your temperament is a recipe for poor decisions under pressure.
  • Am I prepared to read multiple timeframes, not just one? If the honest answer is no, that’s worth addressing before anything else, because a single-timeframe approach will always be missing context the market is actually giving you elsewhere.

There’s no shortcut that skips learning to read price properly at every zoom level you plan to trade from. The good news is that this isn’t something that has to take years to develop. Under the right training, this kind of professional understanding can be built quickly – it’s a matter of learning to see what’s actually there, not accumulating screen-time hours.

Final Thoughts

The best timeframe for price action forex isn’t a specific chart. It’s whichever combination of timeframes lets you read key reversal levels for context and time your entries with precision, in a style that actually fits your life. Higher timeframes tell you what’s genuinely significant. Lower timeframes tell you exactly when to act on it.

If you want to build that skill properly rather than guessing your way through chart after chart, my Forex Training Course walks through the entire process, and Learn to Trade in 5 Days is a complete, standalone course you can start applying immediately.

Thanks for reading and have a beautiful day!
Is Price Action Trading Profitable?

I get asked this question more than almost any other, usually by someone who has just spent a weekend watching YouTube videos about pin bars and engulfing candles and is trying to decide whether to keep going. It’s a fair question. It’s also the wrong question, or at least an incomplete one, because “price action trading” isn’t a single thing you either succeed or fail at. It’s a label that covers wildly different approaches, and whether it’s profitable depends entirely on which version you’re actually trading.

I trade price action for a living. I don’t use indicators as a decision trigger, I don’t follow a system someone sells in a $47 course, and I don’t rely on the textbook patterns that get taught in every “learn price action” video on the internet. So when I answer this question, I’m not answering it as a marketer trying to sell you optimism. I’m answering it as someone who has to be right about this, because my own income depends on it.

Let me walk through what actually determines whether price action trading makes you money, because the honest answer is more useful than the short one.

Why This Question Keeps Coming Up

Most people who ask “is price action trading profitable” have already tried it and lost money, or they’ve watched enough forums to notice a pattern: a huge number of traders who describe themselves as price action traders are not profitable. That observation is correct. Most of them aren’t.

But that’s not evidence that price action itself doesn’t work. It’s evidence that most people trading “price action” are trading a very shallow version of it. If you read what price action in forex actually means, you’ll see the term simply refers to trading decisions made by reading the raw movement of price, without relying primarily on lagging indicators. That’s it. It says nothing about how well the person reading that movement actually understands what’s driving it.

This is where the confusion starts. Reading price action well and reading price action badly produce completely different outcomes, but both get filed under the same label.

The Honest Answer: It Depends Entirely on What You’re Actually Doing

There are, broadly, two versions of price action trading out there, and they produce opposite results.

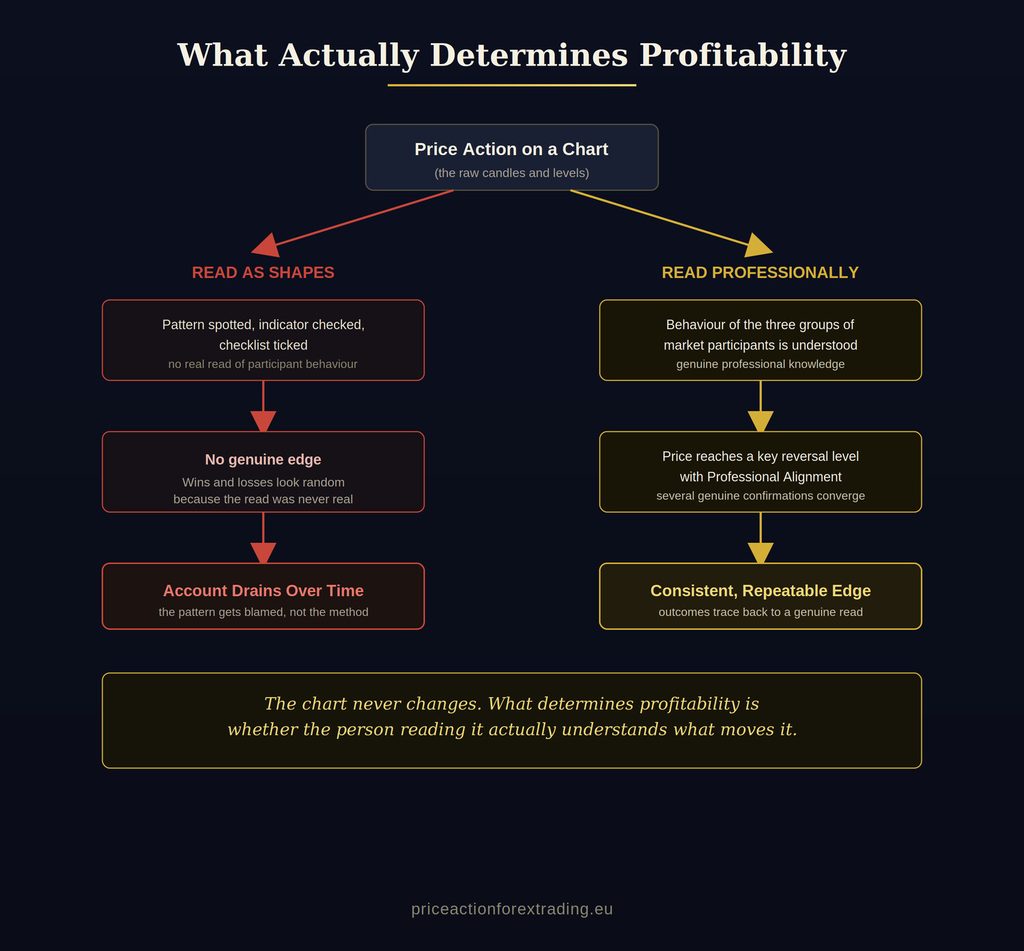
The first version is what almost everyone learns first: memorise a handful of candle shapes, wait for one to appear near a support or resistance line, check a couple of indicators for “confluence,” and take the trade. This is taught everywhere because it’s easy to teach and easy to package into a course. It’s also, in my experience and in the experience of most people who’ve tried it honestly, not a real edge. The shapes themselves carry very little information. A pin bar at a random point on the chart means almost nothing.

The second version is reading what’s actually happening in the market: understanding the behaviour of the participants who move price, recognising the levels where that behaviour becomes readable, and only acting when several genuine confirmations line up. I call this Professional Alignment, and it’s the standard I hold every one of my own trades to before I take them. This version has nothing to do with memorising shapes. It has everything to do with understanding why price does what it does at a given level, which is a different skill entirely.

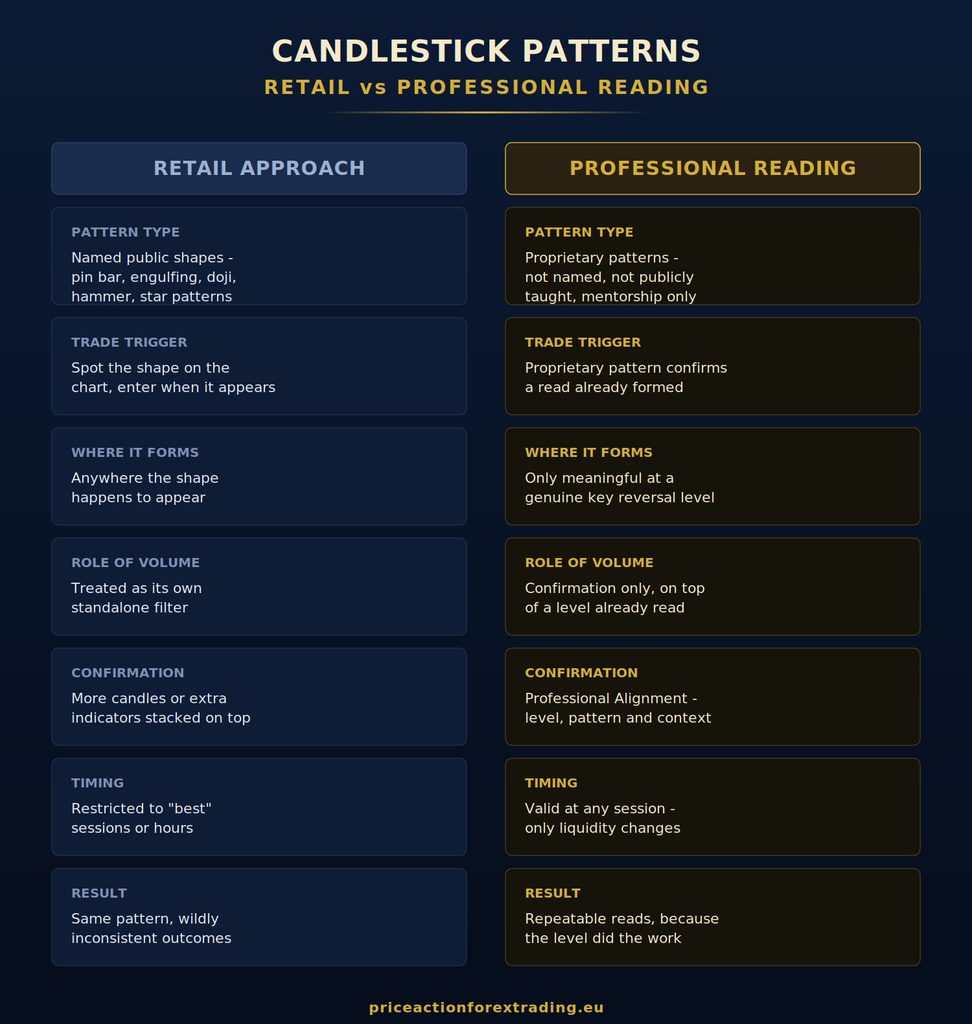
Below is a side-by-side of what separates the two in practice.

Why Most Retail Price Action Traders Lose Money

I want to be specific here rather than vague, because vague explanations are exactly what keep people stuck.

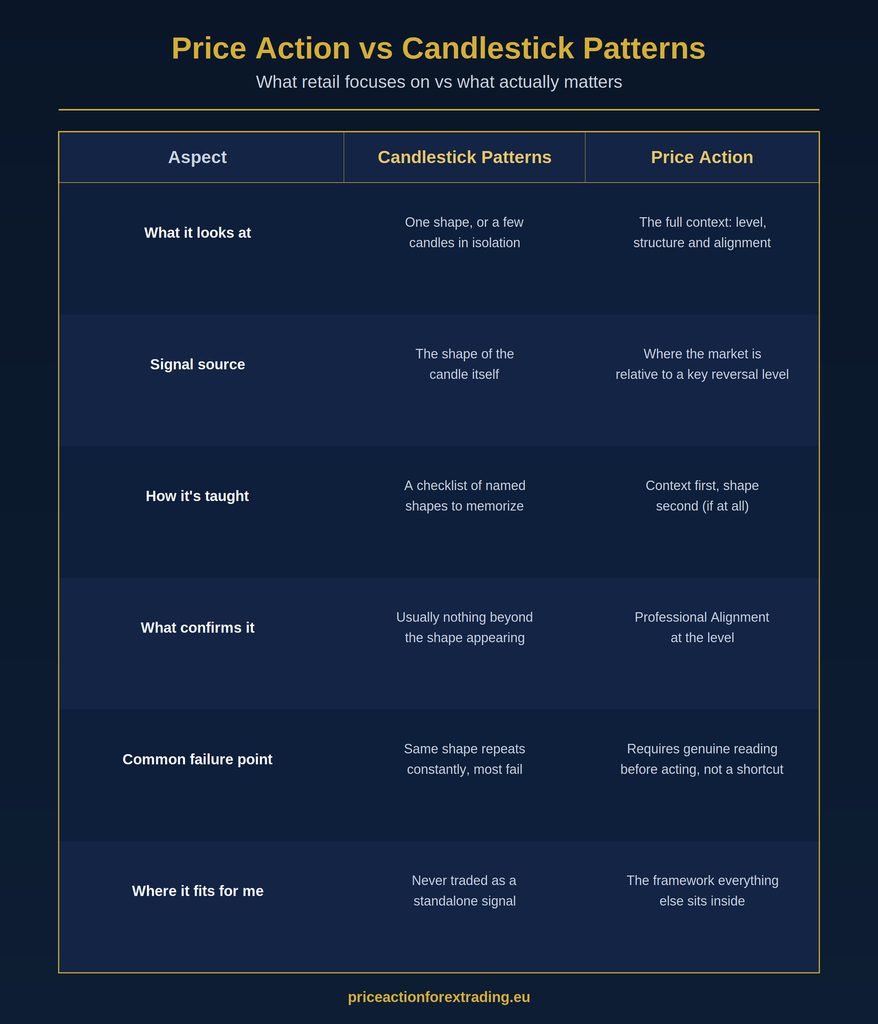
Retail price action fails as a strategy for a simple reason: it treats the symptom as the cause. A candle shape is a symptom of what just happened in the market. It is not the cause of what happens next. When a trader learns to spot a pin bar and treats that shape as the signal itself, they’re reacting to the aftermath of a move rather than understanding the forces that produced it.

This is also why so many retail traders bounce between strategies. They trade pin bars for a few months, lose money, decide pin bars “don’t work,” switch to engulfing candles, lose money again, and conclude that price action trading in general doesn’t work. I’ve written before about why the shape of the candle was never the point and the same logic applies to every named pattern out there. The shape was never carrying the edge. What was missing was genuine understanding of what happens at the level where that shape appeared.

There’s a second reason retail price action struggles, and it’s less discussed: most retail approaches gate their entries on things that don’t actually determine whether a trade works. Trend structure, higher-highs-and-higher-lows checklists, session timing rules. These add the appearance of rigor without adding real information. A key reversal level is either genuinely aligned with what the market is about to do, or it isn’t, and that has very little to do with whether price happened to be in an uptrend on a higher timeframe an hour earlier.

What Actually Makes Price Action Profitable

If shapes and checklists aren’t the answer, what is?

In my own trading, profitability comes from reading the behaviour of what I refer to as the three groups of market participants. I won’t go into who they are publicly here, that understanding is something I only pass on directly to people I train, because it’s the actual mechanism behind why key reversal levels hold or break, and it’s not something that belongs in a free blog post. What I can tell you is that once you genuinely understand how these participants behave at specific levels, price action stops looking random. Patterns that looked meaningless before start making sense, not because the shapes changed, but because you’re finally reading what produced them.

This is the difference between price action as decoration and price action as information. The chart never changes. What changes is whether the person looking at it actually understands what’s moving it.

I go into more detail on how this plays out day to day, including what I actually look at before entering a trade, in how I trade. It’s not a system with rigid rules. It’s a way of reading the market that becomes more precise the deeper your understanding goes.

My Own Results as Evidence

I don’t think claims about profitability mean much without something behind them, so I publish my own trading statements rather than just asserting that this works. I’m not going to walk through every number here, but the short version is that price action trading, done properly, has been consistently profitable for me across different months and different market conditions. It’s not a strategy that only works in trending markets or only works during a particular session. Once you’re reading key reversal levels and participant behaviour rather than session timing or a specific setup shape, the approach travels well across different conditions, because liquidity context changes but the underlying behaviour doesn’t disappear.

That consistency is the real test. Anyone can have a good month. What separates a genuine edge from luck is whether the results hold up over time, across different pairs, across different volatility environments.

How Long Does It Take to Become Profitable

This question comes up almost as often as the first one, and I want to answer it honestly because the industry norm here is dishonest. A lot of trading content tells you that profitability takes years, that you should expect plateaus, that progress isn’t linear and you just need to be patient. I don’t subscribe to that framing. It’s generic advice that applies to someone teaching themselves in isolation with no real feedback loop, and it gets repeated so often that people assume it’s simply how trading works.

It isn’t, if the learning is happening correctly. Under direct, competent mentorship, the gap between “reading shapes” and “reading the market professionally” can close fast, sometimes within days rather than years. The slow, multi-year timeline people associate with becoming profitable is largely a consequence of learning in isolation from public sources that were never going to get you there in the first place. I wrote about this in more depth in how to learn forex trading without wasting years on the wrong things, and it’s worth reading if you’ve been trading for a while and feel like you’re stuck in the same place you were a year ago.

Can You Learn This on Your Own?

Technically, yes, in the sense that nobody is stopping you from staring at charts for years trying to reverse-engineer what actually moves price. Practically, it’s an extremely slow and inefficient path, because the public information available on price action, YouTube channels, forums, most paid courses, teaches the shallow version. You can spend a decade getting very good at spotting pin bars and still not understand why some of them work and most of them don’t.

This is why I’m direct with people about the value of proper mentorship. I learned this from my own mentor, and it fundamentally changed the speed at which I improved. If you’re evaluating whether to find one for yourself, I’ve written a full breakdown of how to find a forex mentor worth learning from, and why most traders never do. It covers the red flags that separate a genuine mentor from someone reselling public information with a personal brand attached.

If you’d rather get straight into structured training, my Forex Training Course walks through the full framework I trade with, built around genuine professional understanding rather than retail checklists. And if you want a faster, focused entry point, Learn to Trade in 5 Days is a complete standalone course built around one strategy, and it’s enough on its own to become profitable if you apply it properly. It’s not a teaser for something bigger. It’s a full, usable approach in five days.

Final Verdict: Is Price Action Trading Profitable?

Yes, but only the version of it that involves genuinely understanding what moves price. The version most people are taught, spot the shape, check the indicator, take the trade, is not price action trading in any meaningful sense. It’s pattern recognition dressed up as a strategy, and it fails for the same reason most retail strategies fail: it mistakes the symptom for the cause.

The version that works requires reading key reversal levels, understanding participant behaviour, and only acting when Professional Alignment is genuinely present. That’s a skill, not a checklist, and it’s learnable, often faster than the industry likes to admit, under the right training.

If you’ve been trading price action and it hasn’t worked, the honest question isn’t “does price action work.” It’s “which version have I actually been trading.” For most people, the answer changes everything.

Thanks for reading and have a beautiful day!
Price Action vs Indicators in Forex: Why Reading Retail Signals Matters More Than Avoiding Them

If you’ve spent any time in forex forums or watching YouTube tutorials, you’ve run into the same debate over and over: price action vs indicators. Which one actually works? Should you use both? Is one “beginner” and the other “advanced”?

Here’s my honest answer, and it might surprise you. I do enter trades on indicator signals sometimes. What most people get wrong about this debate is assuming that avoiding indicator entries is what separates a professional from a retail trader. It isn’t, plenty of retail traders avoid pure indicator entries too, and it doesn’t make them professional. What actually separates the two sides is something most retail education never touches: knowing exactly how retail traders use common indicators, and what decisions they’re likely to make once they see one.

That knowledge is genuinely valuable. It’s information I factor into my own decision-making, and it’s one of the clearest, most factual lines between the retail side of this market and the professional side.

What Forex Indicators Actually Are

Before going further, it’s worth being precise about what an indicator actually does. A moving average, RSI, MACD, stochastic, Bollinger Bands, whatever your platform has loaded by default, they all share one thing in common: they are mathematical calculations built from past price data.

That’s not a criticism, it’s just a definition. An indicator takes closing prices, or highs, lows, volume, from a lookback period, runs them through a formula, and plots the result. This is exactly why indicators are so useful for understanding retail behaviour. Retail traders overwhelmingly rely on a small handful of well-known indicators, applied in fairly predictable ways. That predictability is the whole point of this article.

What Price Action Actually Is

Price action is the direct study of price movement itself, the candles, the levels, the behaviour of the market as it happens, with nothing standing between you and the chart. I’ve written a full breakdown of this in what price action actually means, but the short version is this: instead of asking a formula to summarise the past for you, you read what the market is doing right now, at the exact level where it matters.

This is where every one of my decisions actually starts. Not with an indicator, with price and the behaviour of participants at a key reversal level.

Entry Is the Least Important Part of the Decision

Here’s the piece that gets lost in most “price action vs indicators” content. The decision to enter a trade at all, and the mechanics of exactly when that entry happens, is the smallest, least consequential part of the whole process.

By the time I’m looking at an entry, the real work is already done: the level has been identified, and price and participant behaviour at that level have already been read. What happens at entry, whether that’s on a specific candle, a break of a short-term level, or yes, sometimes an indicator signal, is largely mechanical at that point. The outcome of the trade was already shaped by everything that came before it.

This is exactly why obsessing over whether an entry “counts” as price action or indicator-based misses the point entirely. Both retail and professional traders can technically enter on the same indicator signal. What differs isn’t the entry trigger, it’s everything that led up to it, and what each side understands about why that signal is firing in the first place.

The Real Differentiator: Knowing What Retail Indicators Make Traders Do

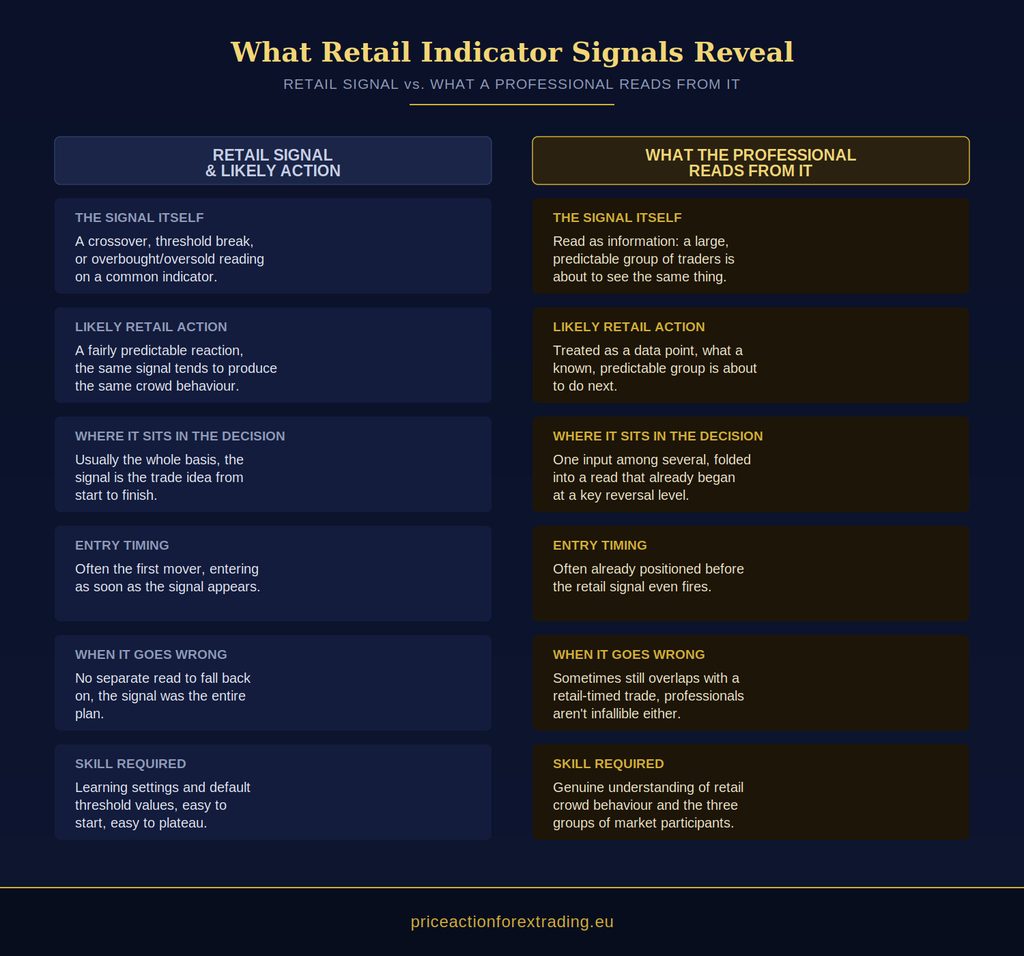
This is the part that actually matters, and it’s the part almost nobody talks about. Retail traders, as a group, use a fairly small set of popular indicators, and they tend to use them in fairly predictable ways. A crossover on a well-known moving average, an RSI reading past a common threshold, a familiar oscillator signal, these produce fairly consistent reactions across a large, predictable group of traders.

To someone with genuine professional understanding of the three groups of market participants, that predictability is information. Knowing what a common retail signal is likely to make a large group of traders do next is a real input into a professional decision, not because the indicator itself is meaningful, but because the behaviour it triggers is. I go into this in more depth in how I actually read momentum, not with indicators, where I look at how retail-driven reactions factor into a professional read of strength and weakness in a move.

This is also why “don’t use indicators” was always the wrong framing. The indicator itself was never the issue. What matters is whether you understand it as a readable piece of retail crowd behaviour, or whether you’re simply following it the way the crowd does.

A Practical Example of the Difference

Picture a well-known indicator flashing a signal that a large portion of retail traders watch closely. A retail trader sees the signal and treats it as the entire basis for a trade, enter now, because the indicator said so.

A professional trader looking at the exact same signal isn’t asking “should I enter.” They’re already read the level, already understand where price is likely going, and they’re now looking at that same retail signal as a piece of information, what is a large, predictable group of traders about to do because of it. Sometimes that information lines up with a trade already being taken. Sometimes it doesn’t matter at all. Either way, it’s read, not obeyed.

Are Professionals Immune to Retail-Timed Trades?

No, and it would be dishonest to claim otherwise. Professional traders aren’t gods, and genuine professional understanding doesn’t come with a guarantee of avoiding every trade that retail traders also end up in. Sometimes a professional entry and a retail entry land in the same trade.

What’s worth noting is the direction that usually happens in. It’s typically retail traders joining a trade after a professional has already entered, reacting late to a signal or a move that’s already underway, rather than professionals following retail traders in first. That distinction matters. Overlap isn’t the same as dependence. A professional trade that happens to coincide with retail activity was still built on a read of price and participant behaviour that came first, retail crowd reaction is something read and factored in, not something waited on.

The Retail and Professional Sides of the Market Are Factually Different

I want to be direct about this because it gets diluted in a lot of trading content: the separation between the retail side of the forex market and the professional side is factual, not a marketing angle. It’s obvious to anyone with genuine professional understanding of how this market actually works, in the same way a structural difference between two systems would be obvious to someone trained to see it, even if it isn’t obvious from the outside.

That doesn’t mean the two sides never intersect, they clearly do, an indicator signal can be looked at by both a retail trader and a professional trader at the exact same moment. What differs is what each side is doing with it. One is reacting. The other is reading a reaction and deciding whether it fits into a decision that was already largely made.

Where Trend and Structure Fit Into This

A lot of retail price action education tries to bridge the gap by teaching structure, higher highs, higher lows, trendlines, as a kind of halfway house between indicators and true price reading. It’s a step in the right direction, but it still tends to get taught as a rigid checklist: you need X structure before a setup counts.

I don’t trade that way. Structure is context, not a gate. A key reversal level can be traded whether or not a clean trend structure is present, what matters is genuine understanding of where price is actually going, combined with price reaching that level. Retail indicator behaviour sits in that same category, useful context that’s read and weighed, never a rigid precondition.

Why This Distinction Matters More Than It Seems

The “avoid indicators” framing that dominates a lot of price action content actually undersells what separates professional trading from retail trading. It focuses attention on the wrong variable, whether an indicator appears on the chart, instead of the variable that actually matters, whether you understand the behaviour that indicator is about to trigger in a large, predictable group of traders.

That understanding doesn’t come from a checklist or from stripping indicators off your chart. It comes from genuine understanding of how the three groups of market participants behave, something that’s trained, not read about. The traders I’ve seen make the fastest progress are the ones who get direct training in that understanding first, and only then start seeing indicators, retail behaviour, and their own entries in proper proportion. Under the right mentor, that shift can happen far faster than most people expect, it isn’t a multi-year process if you’re being trained properly. I explain why in more detail in how to learn forex trading without wasting years on the wrong things.

How to Actually Make the Shift

If you currently treat an indicator signal as the entire basis for a trade, the honest answer is that reordering that isn’t something you piece together from scattered articles and forum threads, mine included. Understanding how the three groups of market participants actually behave at key reversal levels, and how retail crowd reactions to common indicators fit into that picture, is proprietary knowledge that I only reveal to people I’m directly training, because it took real, structured mentorship for me to learn it properly myself.

What I can tell you is that the fastest path isn’t deleting every indicator from your charts, and it isn’t stacking more of them either. It’s learning, directly, how to read what’s actually happening, so an indicator signal becomes information you understand rather than a rule you follow. That’s exactly what I built my Forex Training Course around, taking traders from wherever they currently are to genuine professional understanding, without years of trial and error.

If you’d rather start with something narrower and immediately actionable, Learn to Trade in 5 Days teaches one complete strategy end to end. It’s not a teaser or a funnel into something bigger, it’s a standalone course, and traders have gone on to be profitable from it alone.

Final Thoughts

The price action vs indicators debate usually gets framed as a question of what’s on your chart. That framing misses what actually matters. I use indicators. So do plenty of retail traders. The difference isn’t the tool, it’s whether you understand what a signal is about to make a large, predictable group of people do, and whether your entry is the outcome of a decision that was already made, or the entire decision itself.

The traders who struggle aren’t failing because an indicator is visible on their screen. They’re missing the actual skill, genuine understanding of retail and professional behaviour in this market, that has to come before any signal means anything at all. That skill is learnable. It just isn’t learnable from a formula.

Thanks for reading and have a beautiful day!
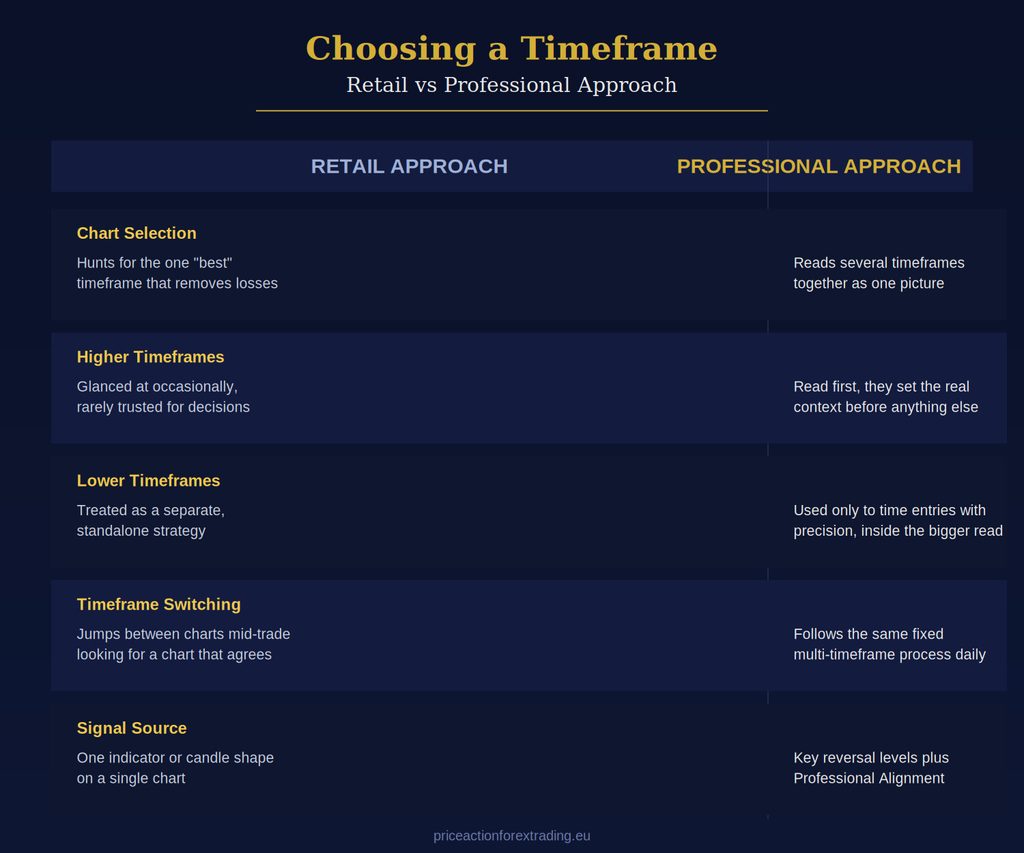
Price Action vs Candlestick Patterns: What’s Actually the Difference?

I get asked this constantly, usually in one of two ways. Either “is price action just another word for candlestick patterns?” or “which one should I actually learn?”

Both questions come from the same place. Most educational content online treats these as interchangeable, so traders end up memorizing a list of candle shapes and calling that “price action trading.” Then they wonder why the shapes don’t work.

They’re not the same thing. One is a small, mechanical piece of chart reading. The other is the entire discipline that piece sits inside of. Confusing them is one of the most common reasons retail traders stay stuck for years, so let’s actually separate them properly.

What Price Action Really Means

Price action, at its core, is the practice of reading a chart using nothing but the price itself, no indicators, no oscillators, no lagging overlays. I’ve written a full breakdown of what this actually looks like in practice over here, but the short version is this: price action is about understanding what’s happening in the market by looking directly at how price has behaved and where it’s positioned now.

That’s a much bigger job than spotting a shape. Genuine price action reading involves:

  • Where price sits relative to key reversal levels
  • How price has approached those levels historically
  • What kind of behaviour has followed similar approaches before
  • Whether there’s Professional Alignment building around the current position

None of that requires a single named candle. You could read all of it from a completely blank chart with no candles at all, just a line. That’s the point. Price action is a reading skill, not a shape-spotting skill.

What Candlestick Patterns Actually Are

Candlestick patterns are a specific, narrow tool that retail education has built an entire industry around. Pin bars, engulfing candles, dojis, hammers, shooting stars, morning and evening stars. Each one gets its own name, its own diagram, and its own “here’s what it means” explanation in every beginner course.

The retail pitch is simple: learn to recognize these shapes, and you’ll know when the market is about to turn or continue. I’ve gone through several of these individually already, pin bars, engulfing candles, inside bars, and the conclusion is always the same. The shape on its own tells you almost nothing.

I put together a broader look at this across the whole category in this article, if you want the full picture on why “patterns that work” is the wrong question to even be asking.

The Actual Difference: A Word vs a Sentence

Here’s the cleanest way I can put it. A candlestick pattern is a single word. Price action is the whole sentence, with grammar, context, and meaning attached.

You can memorize the word “bank” perfectly. But without the sentence around it, you have no idea if someone’s talking about a financial institution or the side of a river. The word alone is meaningless until it’s placed in context.

That’s exactly what happens when a trader spots a “bullish engulfing candle” in isolation. The shape appeared. Fine. But appeared where? After what kind of move? Near what kind of level? With what else lining up around it? Without those answers, the shape is just a word floating with no sentence around it, and trading it blind is how most retail accounts get chipped away one small loss at a time.

Why This Confusion Costs Traders Real Money

This isn’t a philosophical distinction I’m making for the sake of being pedantic. It has a direct, measurable cost.

When a trader treats a candlestick pattern as the actual signal, they’re skipping every step that would tell them whether that pattern means anything at all. They see a hammer candle and buy, because a course told them hammers signal reversals. They don’t check where it printed. They don’t consider what’s been happening in the market leading up to it. They just see the shape and act.

The market prints these named shapes constantly, on every timeframe, all day long, in every currency pair. If the shape itself was a reliable signal, retail traders using this approach would be consistently profitable. They’re not, and the reason isn’t bad luck. It’s that the piece they’re trading was never designed to work alone.

I see this play out the same way over and over. A trader takes a small string of losses on a strategy built entirely around named shapes, so they go looking for a “better” pattern, or a filter to add on top, like only trading the shape on a higher timeframe, or only trading it during a specific session. None of these fixes address the actual problem. They’re all still variations of trading the shape first and asking questions later, just with an extra rule bolted onto the outside of the same flawed process. The shape was never the problem to begin with, and no amount of filtering around it changes what it fundamentally is.

Where a Candlestick Pattern Actually Fits

This doesn’t mean candle shapes are completely irrelevant. They’re just not where the analysis starts, and they’re never the deciding factor on their own.

In genuine professional reading, a candle shape is the smallest, last layer you’d ever look at, if you look at it at all. The layers that actually matter, in order, are the wider market context, whether price has reached a genuine key reversal level, and whether Professional Alignment exists at that level. The candle shape sits at the very center, and by the time you’ve properly read everything around it, the shape itself has told you almost nothing new.

I don’t enter trades based on any of the publicly named patterns. What I actually trade are patterns developed through direct training with my mentor, patterns that aren’t taught publicly and aren’t something I go into detail on here. That training is reserved for people going through the Forex Training Course, because it’s not something that translates well to a blog post. What I can tell you is that the difference isn’t a slightly better shape. It’s a completely different relationship with the chart.

Retail Focus vs What Actually Matters

The comparison is stark once you lay it out side by side.

Retail traders learn candlestick patterns as a checklist. Spot the shape, match it to the textbook definition, take the trade. It feels systematic, which is exactly why it’s appealing to someone starting out. It gives the illusion of a repeatable process without requiring any genuine understanding of the market underneath it.

Professional reading flips the order entirely. Context comes first. The shape, if it’s even considered, comes last, and only ever as one small piece inside a much larger picture that’s already been read correctly before the shape shows up.

Why “Price Action Trading” Got Reduced to Pattern Spotting

If price action is genuinely this much broader, why does almost every beginner resource reduce it to a list of ten candle shapes?

Simplicity sells. A named shape with a picture is easy to package into a course, easy to put in a PDF, easy to test someone on with a quiz. “Here are ten shapes, memorize them” is a product you can build and sell in a weekend. “Develop a genuine understanding of how price behaves at levels” is not something that fits neatly into a checklist, so it doesn’t get taught that way in most public content.

There’s also a search-engine effect at play here, and it’s worth naming directly. “Candlestick patterns” and “price action” both get searched heavily, and content creators know that a post titled “Top 10 Candlestick Patterns You Need to Know” will rank and get clicked far more reliably than a post trying to explain genuine market reading. So the internet fills up with pattern lists, each one recycling the same handful of shapes with slightly different wording, and newer traders assume that volume of content equals validity. It doesn’t. It just means the easy version got produced ten thousand times over, while the harder, more accurate version got produced rarely.

This is also why so much of what’s labeled “price action strategy” online is really just candlestick pattern trading wearing a different name. Swap the word “candlestick” for “price action” in a title, keep the exact same pattern list underneath, and you’ve got a piece of content that sounds more sophisticated without actually teaching anything different. The market doesn’t reward memorized checklists, which is a big part of why so many traders spend years going in circles without ever getting anywhere close to genuine competence, no matter how many pattern guides they’ve read.

What Actually Reading Price Action Looks Like

If patterns aren’t the foundation, what is? It comes down to a few genuine skills that take direct training to build properly.

First, understanding key reversal levels, not as lines you draw with a ruler, but as areas where genuine turning behaviour has repeatedly shown up. Second, reading how price is behaving as it approaches those levels, which requires actual market understanding rather than a rulebook. Third, recognizing Professional Alignment when multiple things line up in the same direction at the same level, rather than acting the moment one thing looks interesting.

None of this happens overnight through self-study alone, and I’m not going to pretend otherwise. But it also doesn’t require years of trial and error, which is the other extreme a lot of guru content pushes. Under the right mentor, with direct training, this kind of understanding can develop genuinely fast. That’s exactly the structure behind Learn to Trade in 5 Days, a complete standalone course built specifically to get you reading price properly rather than handing you another list of shapes to memorize.

A Quick Way to Test Yourself

Here’s a simple gut check. Look at any candle pattern you’ve been taught to trust, a pin bar, an engulfing candle, whatever it is. Ask yourself: could I explain why this particular one matters without mentioning the shape at all?

If your answer leans entirely on “because it’s a pin bar” or “because it’s engulfing,” you’re trading the word without the sentence. If you can point to the level, the context, and the alignment around it, independent of what the candle looks like, you’re already thinking in the right direction.

Most retail traders can’t answer that question without falling back on the shape, because the shape is all they were ever taught to look for. That’s not a knock on them individually. It’s a gap in how this subject gets taught publicly, and it’s the exact gap I built this site to close.

I’d also push back gently on one common workaround I see traders try: adding indicators on top of pattern spotting to feel more confident about a shape. A moving average, an RSI reading, a volume bar. None of these fix the underlying issue, because they’re still being layered onto a signal that was never the actual signal in the first place. Volume, when it’s used at all in genuine reading, only ever confirms a level that’s already been read correctly beforehand. It’s never a standalone trigger, and neither is any other indicator bolted onto a candle shape after the fact.

Bringing It Together

Price action and candlestick patterns aren’t the same thing, and treating them as interchangeable is probably costing you more than you realize. Price action is the discipline of reading the market genuinely, through key reversal levels, context, and Professional Alignment. Candlestick patterns are one small, optional, last-in-line detail inside that discipline, never the discipline itself.

If you’ve been trading named shapes and wondering why results haven’t followed, this is likely the reason. The fix isn’t a better pattern. It’s building genuine market understanding around the patterns you were told mattered, and learning to see everything that actually surrounds them.

Thanks for reading and have a beautiful day!
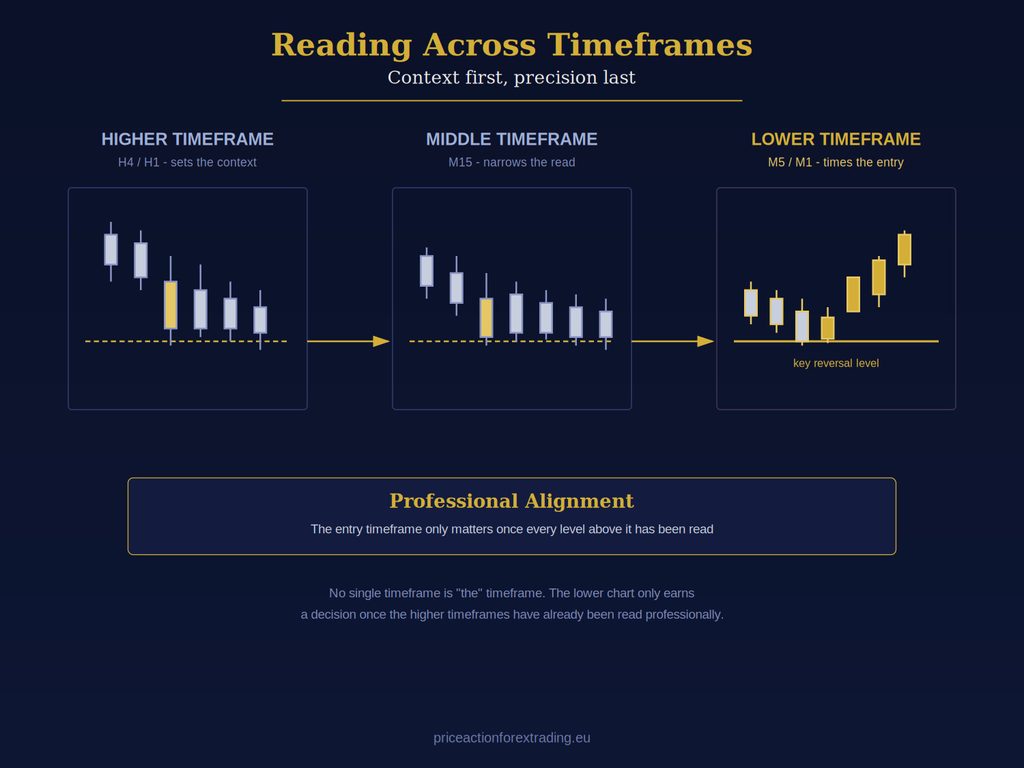
Forex Candlestick Patterns That Work: Why the Shape Was Never the Answer

If you’ve typed “forex candlestick patterns that work” into Google, I already know what you’re hoping to find. A list. Pin bar, engulfing, doji, hammer, morning star, all ranked by win rate, so you can memorise the winners and skip the losers.

I’m going to save you some time. That list doesn’t exist, because the premise behind it is wrong.

I’ve spent years reading price on live charts, and I can tell you with total confidence that no candlestick shape “works” on its own. The same pin bar that prints a clean reversal on one chart will get run over ten pips later on another. The shape is identical. The outcome isn’t. If the shape itself carried the edge, that couldn’t happen.

So this article isn’t going to rank patterns for you. It’s going to explain what actually separates a candlestick pattern that works from one that doesn’t, which has almost nothing to do with the candle itself.

The Patterns Everyone Is Searching For

Before I get into why the shape isn’t the point, let’s quickly cover the patterns retail traders spend the most time memorising. You’ve probably seen all of these:

  • Pin bar – a candle with a long wick and a small body, supposedly signalling rejection at a level
  • Engulfing candle – a candle whose body fully swallows the previous one, taught as a strong reversal signal
  • Doji – a candle with almost no body, framed as “indecision”
  • Inside bar – a candle that sits entirely within the range of the one before it
  • Morning star / evening star – a three-candle sequence marking a supposed turning point
  • Hammer / shooting star – single-candle variations of the pin bar concept, usually tied to trend exhaustion

I’ve written dedicated breakdowns of two of the most searched patterns on their own pages, because they deserve a full explanation rather than a paragraph each. If you want the deep dive, read my articles on the pin bar and the engulfing candle. Both cover the same theme you’ll find running through this article: the pattern is not the edge, the location and the reading behind it are.

Why “Which Pattern Works Best” Is the Wrong Question

Here’s the retail approach in a nutshell: scan every chart for a specific shape, treat that shape as a signal, and enter when it appears. It’s a checklist. Spot the shape, tick the box, place the trade.

The problem is that a candlestick shape tells you what price did over one candle. It tells you nothing about who was actually behind that move, or what’s likely to happen next. Two identical pin bars can form for completely different reasons, at completely different points in the market’s structure, and produce completely different results.

This is why so many traders who “know” every pattern still lose consistently. They’ve memorised the vocabulary without understanding the language. Knowing that a hammer has a small body and a long lower wick is like knowing that the word “bank” exists in English. It tells you nothing about which meaning applies in a given sentence.

At priceactionforextrading.eu, I don’t teach shape recognition. I teach traders to read what’s actually driving what is price action in the first place, which comes down to genuinely understanding how the market’s participants behave. That’s the part almost nobody teaches, because almost nobody outside a professional environment actually understands it.

What Actually Makes a Candlestick Pattern Work

If the shape isn’t the answer, what is?

Two things have to line up before I’ll ever treat a candlestick pattern as meaningful.

First, location. A pattern only matters when it forms at a key reversal level, a price point where I already have a genuine read on how the market’s participants are likely to behave. A pin bar in the middle of nowhere is just a candle. The exact same pin bar at a key reversal level is a different animal entirely, because now it’s forming exactly where my read on the market said something was likely to happen.

Second, Professional Alignment. This is the term I use for the way multiple pieces of evidence converge before I treat a setup as valid. A candlestick shape by itself is one data point. It’s not enough on its own, and it was never supposed to be. What makes a pattern tradeable is when the shape, the level, and the broader context all point in the same direction at the same time. That convergence is what I mean by Professional Alignment, and it’s the actual foundation of everything I trade.

This is the piece that gets left out of every “candlestick patterns that work” article you’ll find elsewhere. They treat the candle as a standalone signal because that’s all a shape-recognition approach can offer. Professional trading works the other way around. The level and the read come first. The candle is just the final piece of evidence, not the trigger on its own.

The Role of Key Reversal Levels

I can’t talk about candlestick patterns without talking about key reversal levels, because the two are inseparable in how I actually trade.

A key reversal level isn’t just a line I drew on a chart because price touched it twice. It’s a price point where my understanding of the market’s participants tells me something meaningful is likely to happen. When a candlestick pattern forms at one of these levels, it’s not a coincidence I’m chasing. It’s the market doing exactly what my read said it would do, with the candle simply confirming it.

This is also where most retail traders go wrong twice over. First, they mislabel ordinary price zones as significant levels using retail tools that don’t reflect genuine professional understanding of where the market is actually likely to turn. Then they layer a candlestick pattern on top of a level that was never meaningful in the first place, and wonder why the “textbook setup” fails.

Get the level wrong, and it doesn’t matter how clean the candle looks. The pattern has nothing real to confirm.

This is also why I never restrict candlestick reading to a particular session or time of day. A genuine key reversal level doesn’t stop being valid because it’s the Asian session instead of London. What changes across sessions is liquidity, not the validity of the level itself. A candlestick pattern that forms at a real key reversal level during a quieter session can be just as significant as one that forms during the busiest hours, provided the alignment behind it is genuine.

Volume: Confirmation, Never a Trigger

Volume gets bundled into a lot of candlestick pattern strategies as an add-on filter. “Only trade the pin bar if volume spikes.” I understand the appeal of that rule. It feels like an extra layer of objectivity.

But volume isn’t a standalone signal, and I don’t treat it as one. It’s confirmation of a level I’ve already read professionally, nothing more. If I’m looking at a candlestick pattern at a key reversal level and the volume behind it supports what I already expect to happen, that adds weight. If I hadn’t already identified the level correctly, no amount of volume on the candle would make the pattern valid. Volume never creates the read. It only confirms one that already exists.

Single Candle Versus Multi-Candle Patterns

One question I get asked often is whether multi-candle patterns like the morning star or evening star are more reliable than single-candle patterns like the pin bar, purely because they involve more price data.

They aren’t, and the reasoning behind that belief is another version of the same mistake. More candles doesn’t mean more genuine evidence. It just means more shape to memorise. A three-candle formation in the wrong location, with nothing real aligned behind it, is no more valid than a single misplaced pin bar. What determines reliability was never the candle count. It’s still the level and the alignment.

If anything, single-candle patterns force traders to be more disciplined about where they’re looking, because there’s less shape to hide behind. A multi-candle formation can feel more “confirmed” simply because it took longer to form, which is a psychological trap more than an analytical advantage.

Common Mistakes Traders Make With Candlestick Patterns

I see the same handful of errors repeated across every trader who reaches out to me still relying on pattern memorisation alone.

Trading the shape anywhere it appears. If the only qualification for a trade is “I saw a pin bar,” the level has been skipped entirely. That’s the single biggest mistake in this category, and it’s the one retail education reinforces the most.

Treating every pattern as equally reliable. A pattern’s usefulness has nothing to do with how “textbook” it looks and everything to do with where it formed and what’s aligned behind it. A messy-looking candle at a genuine key reversal level with real Professional Alignment behind it will outperform a picture-perfect pattern in the wrong location, every time.

Ignoring who is actually behind the move. The market is made up of distinct groups of participants who behave in genuinely readable ways at the right levels, and this is the part of my framework I keep confidential for a reason. It’s not publicly taught, and it isn’t something you’ll piece together from YouTube or forum threads, which is exactly why most retail pattern trading never gets past guesswork. Understanding how these groups actually behave is what turns a shape into something you can genuinely read, rather than something you’re hoping repeats.

Gating patterns on unnecessary structure. I regularly see traders refuse to act on a valid setup because price hasn’t printed a “confirmed” higher high or lower low first. That’s a retail checklist habit, not a requirement. A pattern can be valid within a trend, against one, or completely independent of trend structure altogether, provided the level and the alignment behind it are genuine. Waiting on structure to “confirm” itself is often just waiting until the best part of the move is already gone.

Overloading the chart with indicators to compensate. When the candle itself doesn’t feel like enough evidence, plenty of traders stack on moving averages, oscillators and momentum indicators hoping the extra lines will do what genuine reading should be doing. It rarely helps. Indicators describe price after the fact. They don’t explain who is behind the move or why a level is likely to hold, which is the actual question a candlestick pattern is supposed to answer.

How I Actually Use Candlestick Patterns

Here’s something worth being upfront about. Every pattern named in this article, the pin bar, the engulfing candle, the doji, the inside bar, the morning and evening star, the hammer and shooting star, is retail vocabulary. I don’t enter a single trade off any of them.

That’s not a contradiction of anything I’ve said above. Those are the shapes the public has been taught to look for, which is exactly why I’ve used them here to explain the difference between shape-recognition and genuine reading. The actual patterns I act on aren’t named on any retail chart course, and you won’t find them described on this page or anywhere else publicly. What I trade comes from proprietary pattern reading developed through direct training with my mentor, and it isn’t something that translates into a blog post. That level of detail is reserved for traders inside my training course and mentorship, where I can actually show it rather than describe it.

What I can tell you, and what does translate, is the process behind it. A candlestick pattern, named or proprietary, is always the last piece of a decision, never the first. By the time I’m watching for one to form, I’ve already identified the key reversal level, and I already have a genuine read on how the market’s participants are likely to behave there. The pattern is confirmation that the read is playing out the way I expected, not the trigger that creates it.

That’s a completely different process from scrolling through a chart hunting for shapes. It’s slower to describe, but it’s also the reason I can act with real conviction the moment a setup appears, instead of hoping a memorised pattern happens to work this time.

This is professional thinking applied with professional knowledge, and it’s the actual difference between traders who make candlestick patterns work and traders who keep collecting new pattern lists because the last one didn’t.

Where This Understanding Actually Comes From

None of this is something you piece together from free YouTube breakdowns or forum threads dissecting old screenshots. Genuine understanding of how the market’s participants behave, and how that behaviour shows up at key reversal levels, comes from direct, structured training. It’s not a slow process either. Under the right guidance, this kind of understanding can click fast, sometimes within a single session, because it’s a matter of being shown correctly rather than accumulating years of trial and error.

That’s exactly what I built my Forex Training Course around. It’s suited to traders at any stage, not just people with years of screen time already behind them.

If you’d rather get there faster with a single, complete strategy you can start applying immediately, my Learn to Trade in 5 Days course teaches the full professional approach behind reading candlestick patterns correctly, level, alignment and all, in a standalone format. You don’t need anything beyond it to start trading with real understanding.

The Real Answer to “Which Candlestick Patterns Work”

None of them work in isolation. All of them can work (coincidentally) at the right level, with the right alignment behind them.

That’s not the answer people expect when they search for a ranked list of winning shapes, but it’s the honest one, and it’s the reason I keep writing about this from a completely different angle than the rest of the internet. The shape was never the edge. It was always just the last thing to confirm what a professional read had already told you. However, professional traders do not use retail candlestick patterns to confirm their entries – they use their own proprietary patterns that I teach only directly to my mentees during live market conditions (no pdfs or pre-recorded videos).

Thanks for reading and have a beautiful day!
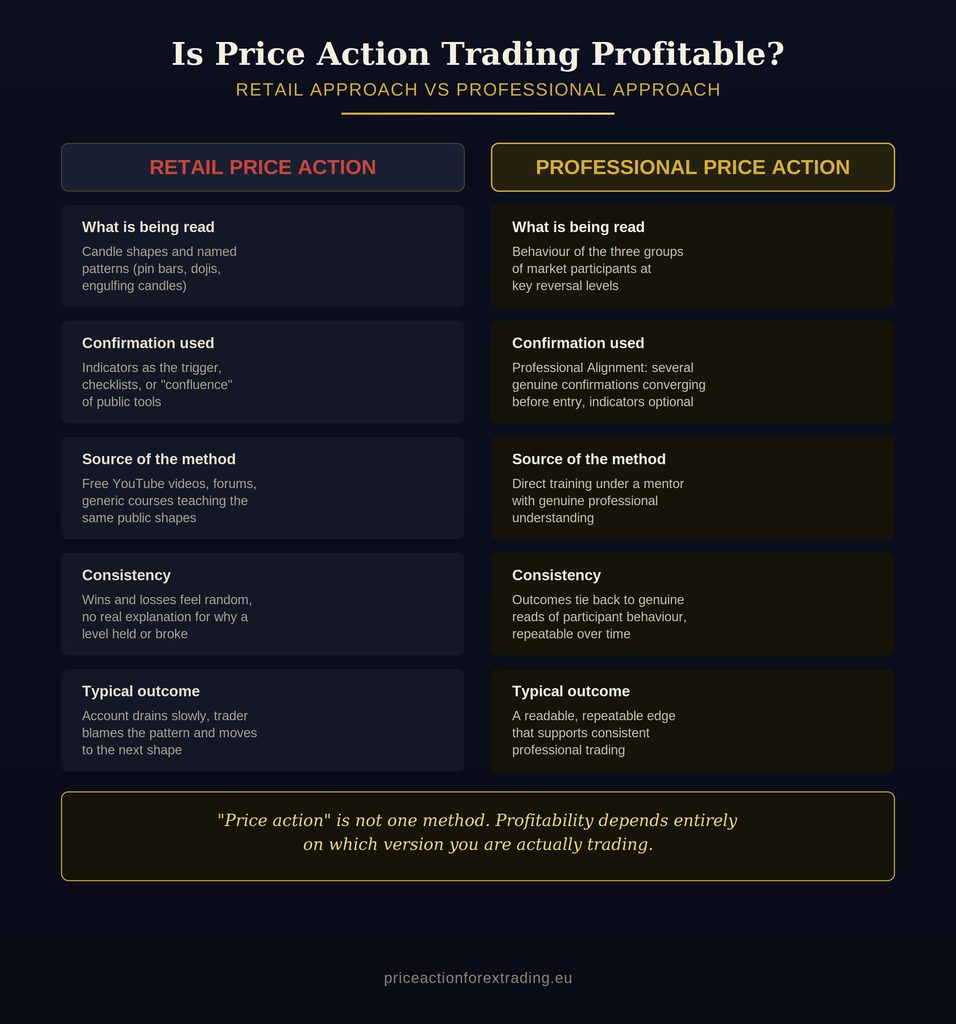
Inside Bar Forex Strategy: Why I Never Trade It, Even Though I Watch For It Constantly

I still remember the first time I “found” an inside bar setup. I marked the mother bar, drew my two entry lines above and below it, set my alerts, and waited. Price broke one side, stopped me out, then ripped through the other. That was my introduction to a pattern that gets sold to retail traders as a clean, mechanical setup and almost never behaves that way in practice.

The inside bar is one of the most recognisable shapes on a forex chart. A small candle tucked entirely inside the range of the one before it. It looks tidy. It looks like something is “about to happen.” And that visual neatness is exactly why so many traders build entire strategies around it.

Here’s where I stand on it today: I notice inside bars constantly, on every pair, at every point on the chart. I just never trade them. Not at a key reversal level, not with confirmation, not under any condition. It’s a completely retail pattern, and I want to walk through why that’s the case, what I actually use it for, and what I do instead.

What an Inside Bar Actually Is

An inside bar is simple to define. It’s a candle whose full high-to-low range sits inside the high and low of the candle before it, sometimes called the “mother bar.” No new high, no new low. The market takes a breath.

Retail material usually explains this as “indecision” or “compression before expansion.” You’ve probably read that language before, maybe alongside a description of the setup as a coiled spring. It’s a memorable image. It’s also not particularly useful, because it treats a shape as if the shape itself carries meaning.

Here’s the part that gets skipped in most explanations: an inside bar forms constantly, everywhere on a chart, in every kind of market condition. It’s one of the most common shapes there is. That alone should tell you something about how much weight it deserves as a standalone signal.

The Retail Inside Bar Strategy, and Why It Struggles

The standard retail approach to inside bars is a breakout play. Mark the high and low of the mother bar, place a buy stop above and a sell stop below, and let the market pick a direction. Whichever side gets hit first becomes the trade, and the opposite order gets cancelled.

On paper it sounds disciplined. In practice it has a structural problem: it treats every inside bar the same way, everywhere it forms, as if a pause in the range is itself a reason to enter the market. The strategy was built entirely around the shape of one candle relative to the one before it, and nothing else.

This is the same trap I’ve written about with other single-candle setups. When I broke down the pin bar forex strategy, the core issue was identical: traders were reacting to a candle’s shape instead of asking what actually drives price at that point on the chart. The inside bar has the same weakness. I just take it a step further than most retail material is willing to, and say outright that I don’t trade the pattern, full stop.

Add to that the habit of trading inside bars purely because “the pattern formed,” several times a week, on every pair being watched, and you get a strategy that fires constantly, wins inconsistently, and never builds the kind of repeatable edge that professional trading actually requires.

What I Actually Use the Inside Bar For

If I don’t trade it, why do I still pay attention to it at all? Because noticing an inside bar tells me something about the crowd, even though it never tells me anything worth acting on directly.

An inside bar sitting on a chart means a specific group of retail traders is about to do something predictable with it. Orders get built above and below that small range the moment traders spot the pattern, the same way I once built mine. That’s useful information about positioning, not because I’m going to trade the inside bar itself, but because understanding what the retail crowd tends to do at any given moment is part of reading the market the way I’ve been trained to.

I’ve written before about the three groups of market participants that actually move a currency pair, and I keep that framework deliberately private beyond a certain point. What I can say is that a pattern like the inside bar is far more useful to me as a marker of retail expectation than it ever was as a trade trigger. Seeing one doesn’t change what I do. It occasionally confirms what I already expect the crowd around me to be doing.

Why Location Doesn’t Change My Answer

You might expect me to say the pattern becomes tradeable once it forms at a key reversal level, the proprietary term I use for the handful of price points on any chart that actually carry weight. It doesn’t. I go into far more depth on how I identify and use these levels in my piece on key reversal levels in forex, and that piece describes exactly how I read price at these points. An inside bar forming there doesn’t change that process.

When price reaches a genuine level, I’m reading it through Professional Alignment, multiple genuine confirmations converging before I’d ever consider an entry. Whether the candle that happens to be sitting there is an inside bar, a pin bar, or something with no name at all makes no difference to that read. The level does the work. The candle shape doesn’t add anything to it, and I’ve never found a version of “inside bar at a level” that earned a different treatment than any other candle at that same level.

This is worth being direct about, because a lot of price action content tries to have it both ways: dismiss the pattern in general terms, then quietly reintroduce it as valid “in the right context.” I’d rather just say it plainly. The pattern isn’t part of how I trade, in any context.

Common Mistakes Traders Make With Inside Bars

A few patterns show up again and again with traders I talk to who’ve built strategies around this setup specifically.

The first is trading every inside bar they see, everywhere it forms, treating frequency as opportunity rather than noticing that a pattern this common can’t realistically carry a standalone edge.

The second is over-filtering with indicators. Traders add a volatility indicator, a moving average, sometimes two or three additional tools, trying to build confidence in a setup that was never going to become reliable no matter how it’s filtered. Layering more indicators onto a pattern I don’t trade doesn’t make it worth trading, it just adds noise to noise.

The third is gating the setup behind a rigid checklist, things like requiring a specific trend structure or a certain number of prior candles before an inside bar “counts.” I don’t gate any setup this way, including pullbacks, and I’m not going to make an exception here either. What actually qualifies a trade to be taken is genuine professional understanding of where price is going, combined with a genuine key reversal level. An inside bar contributes neither.

The fourth is treating a breakout of the inside bar’s range as automatic confirmation of anything. Price moving beyond either side of that small range is simply price continuing to move. It doesn’t validate a trade idea on its own, and I don’t treat it as if it does.

How I Actually Approach Inside Bars Now

These days an inside bar barely changes what’s on my screen. I see it, I register that a specific slice of the retail crowd is likely building orders around it, and I move on. My actual decisions come entirely from key reversal levels and Professional Alignment, exactly the same process I’d apply if that candle had never formed at all.

This ties directly into how I think about market structure more broadly. If you want the fuller picture of how I read price without leaning on retail frameworks, my article on how to identify trend in forex covers the thinking that sits underneath almost everything I do, including why a pattern like this one never makes it into my decision-making.

None of this happened overnight for me, and it doesn’t need to take years for you either, not with the right training behind it. What changed my results wasn’t finding a smarter filter for the inside bar breakout. It was learning to read the market the way my mentor actually taught me, which meant dropping single-candle patterns as trade triggers almost entirely.

Where Genuine Understanding Comes From

If there’s one thing I hope you take from this, it’s that the inside bar was never the edge, and dressing it up with better filters or stricter rules doesn’t change that. It’s a shape that forms constantly and tells you almost nothing about what’s coming next. What actually pays is understanding key reversal levels, reading Professional Alignment, and having the professional thinking to act on that read with real conviction, independent of whatever candle happens to be sitting on the chart at the time.

That kind of understanding isn’t something you’ll find by adding another indicator or memorising a longer checklist. It comes from direct training. If you’re ready to build that foundation properly, my Forex Training Course is built for exactly this, taking traders from wherever they currently are to a genuine professional understanding of how this market actually moves. And if you want to see how fast that shift can happen when you’re learning one strategy properly from the ground up, Learn to Trade in 5 Days is a complete course on its own, built to get you trading with real understanding in a matter of days, not years.

The inside bar isn’t going anywhere. It’ll keep showing up on your charts every week, in every pair, everywhere you look. The only question is whether you keep building strategies around it, or start understanding why I stopped a long time ago.

Thanks for reading and have a beautiful day!