Breakout trading is one of the first strategies almost every new trader tries, and one of the first strategies that quietly destroys their account. The idea sounds simple enough: price has been stuck inside a range, it finally pushes through a line on the chart, and you jump in expecting the move to run. In practice, most breakout trades end the same way – price pokes through the line, traders pile in, and within a few candles the whole move reverses and stops them out.
I want to walk you through why that happens, what a breakout actually represents when you understand who is really moving price, and how I approach these situations differently than the retail crowd does.
What Retail Traders Think a Breakout Is
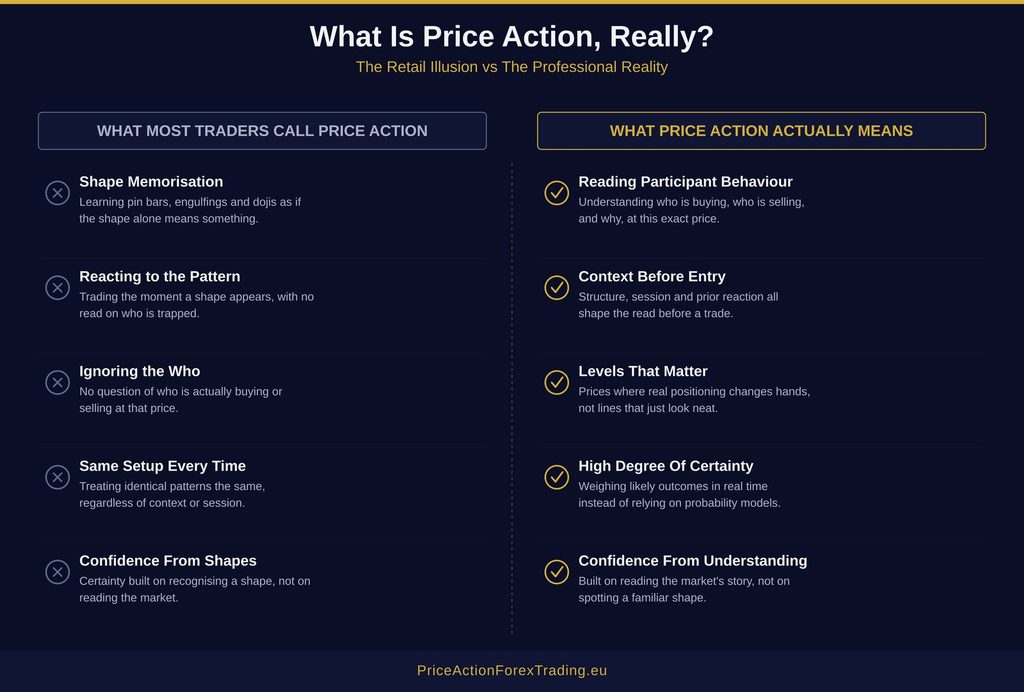
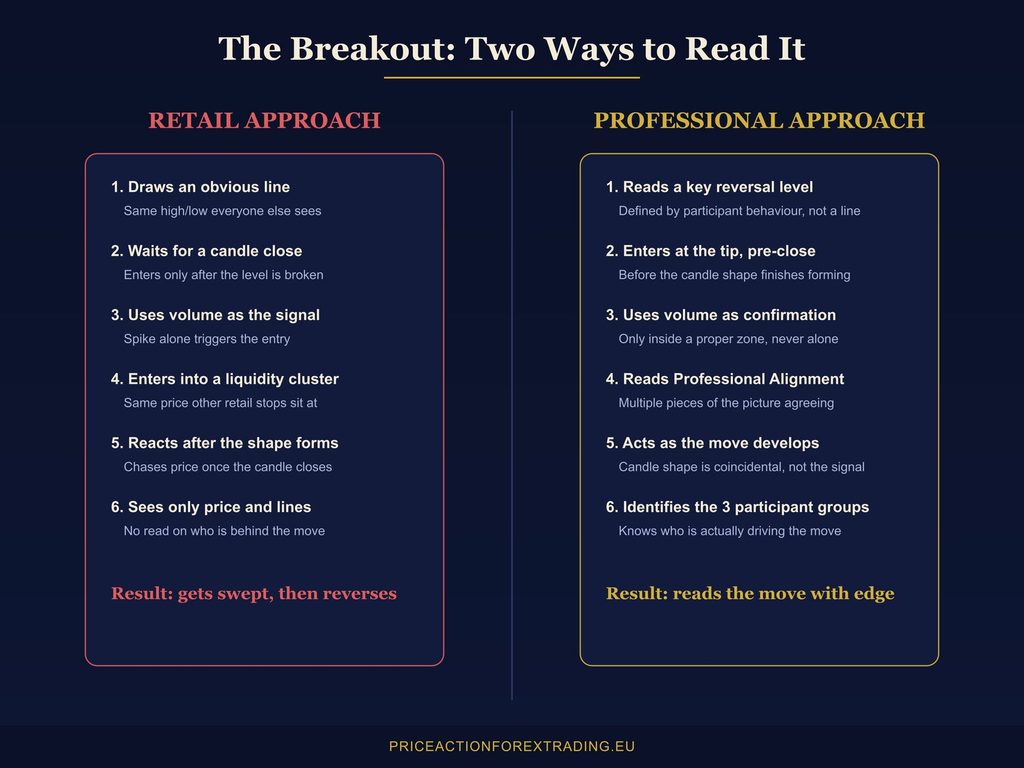
The public version of breakout trading goes something like this: draw a horizontal line at an obvious high or low, wait for a candle to close beyond it, and enter in the direction of the break. Some variations add a volume spike as extra confirmation, or a retest of the line before entering.
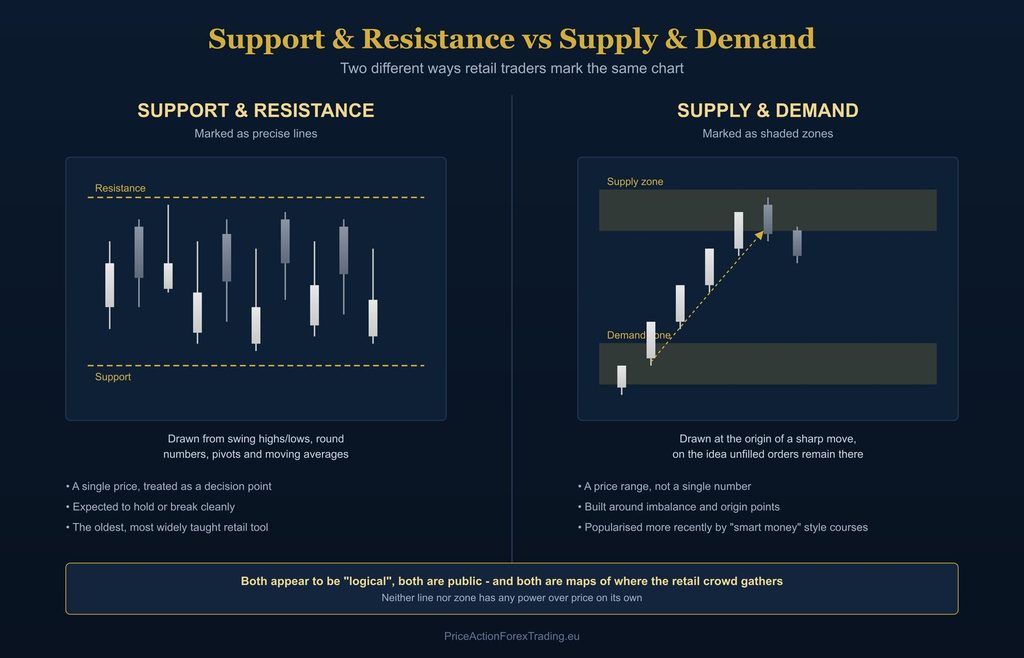
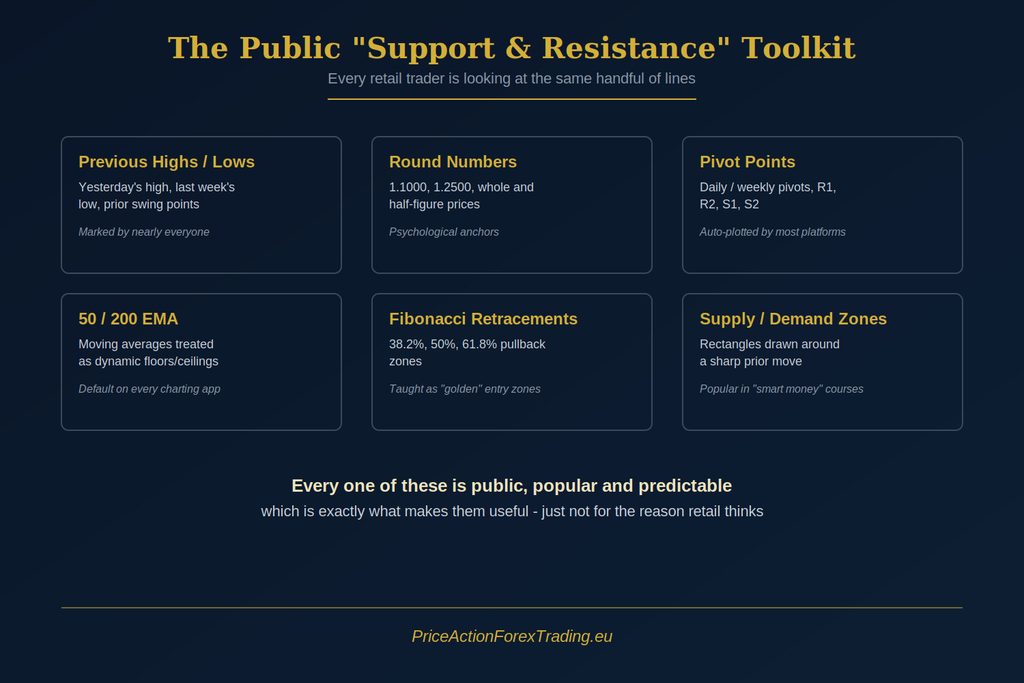
On paper this looks logical. A price level has been respected multiple times, so a decisive close beyond it must mean something has changed. The problem is that this entire approach is built on a level that thousands of other retail traders can see on the exact same chart, using the exact same indicators, drawn the exact same way. If you can spot that line in five seconds, so can everyone else running the same course or the same YouTube tutorial.
That’s precisely why I don’t use ordinary support and resistance the way it gets taught publicly. I’ve written in detail about what actually happens at those obvious lines in my article on support and resistance zones and what retail actually does there, and the same logic applies directly to breakouts. If a level is popular enough for thousands of traders to place orders around it, it becomes a target, not a launchpad.
Why Most Breakouts Fail
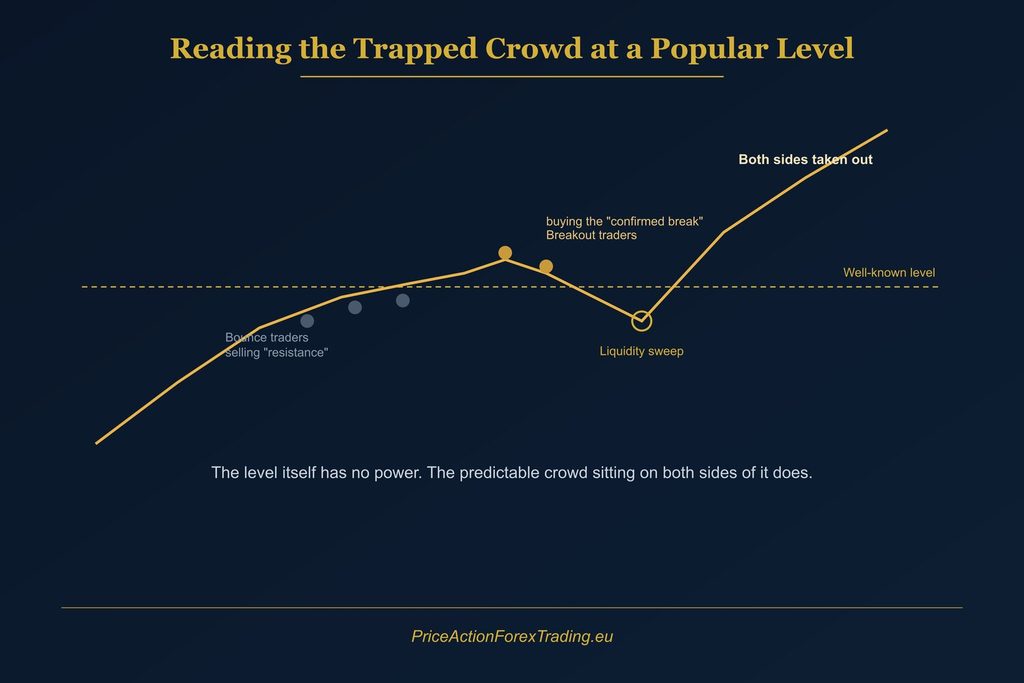
Here’s what tends to happen at a well-known level. Retail traders who were trading the range place their stop-loss orders just beyond it, because that’s what every course teaches. Breakout traders, at the same time, place their entry orders in the same spot, expecting the level to give way and momentum to follow. Both groups are clustering their orders around one price.
When price finally reaches that area, there’s a concentration of liquidity sitting right there, waiting to be used. Price pushes through, triggers the cluster, and then has nothing left to sustain the move because the very traders who would have kept it going have already been filled or stopped out. What looks like a “false breakout” on a retail chart is, from where I stand, a completely predictable outcome once you understand whose orders are sitting at that price and why.
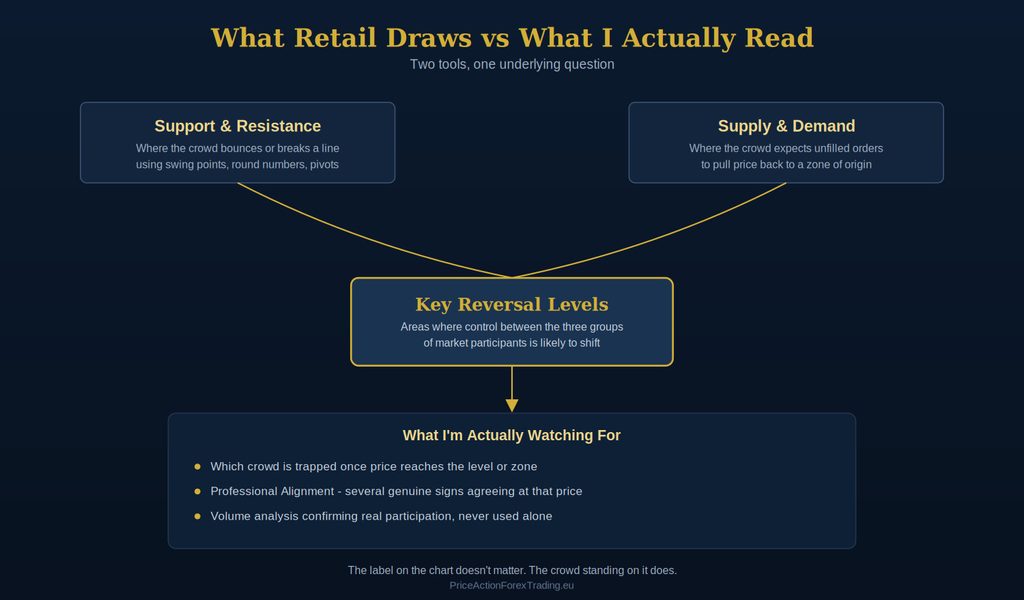
This is where my framework differs from what gets taught in most courses. I don’t think in terms of support and resistance lines that get broken or held. I think in terms of key reversal levels – specific price areas where the balance of activity from the three groups of market participants who actually move this market shifts direction. That distinction matters enormously for how you read a breakout, because a key reversal level isn’t just a line that price crosses. It’s an area that tells you something about who is in control before the candle even finishes forming.
The Professional View of a Breakout
When I look at a chart, I’m not asking “did price close beyond the line.” I’m asking what the candles leading into that area are telling me about which of the three groups of market participants is active, and whether what I’m seeing lines up with the story the higher timeframe has already been telling me. When several pieces of the picture point in the same direction, I call that Professional Alignment – and it’s this alignment, not a single broken line, that tells me whether a move beyond a key reversal level has real weight behind it or is simply liquidity being swept before price reverses.
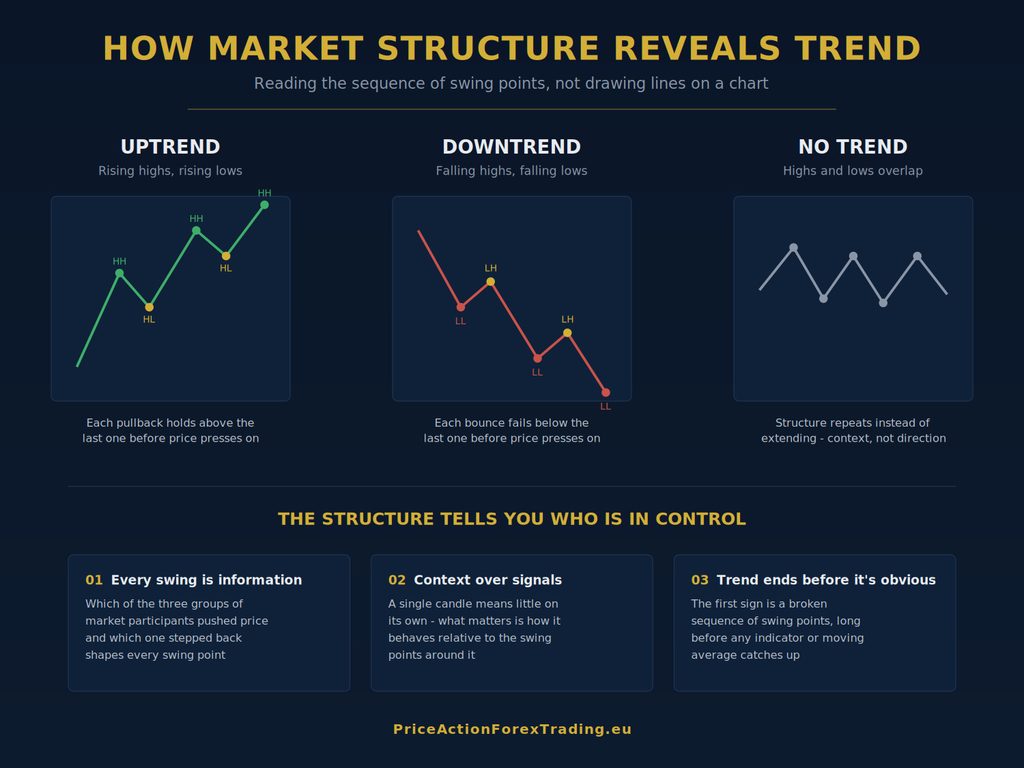
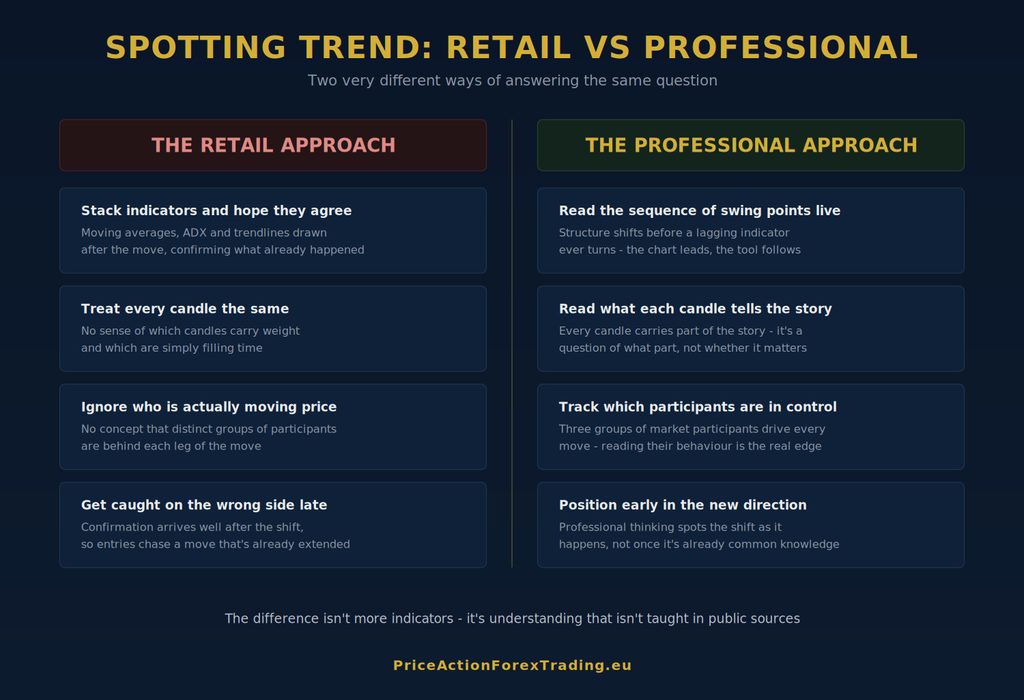
This is also where trend context matters. A breakout that goes with the underlying structure of the market behaves very differently from one that goes against it. If you haven’t already, it’s worth reading my piece on how to identify trend in forex, because most retail definitions of trend are built on the same flawed logic as their breakout entries – obvious highs and lows that everyone else is watching too.
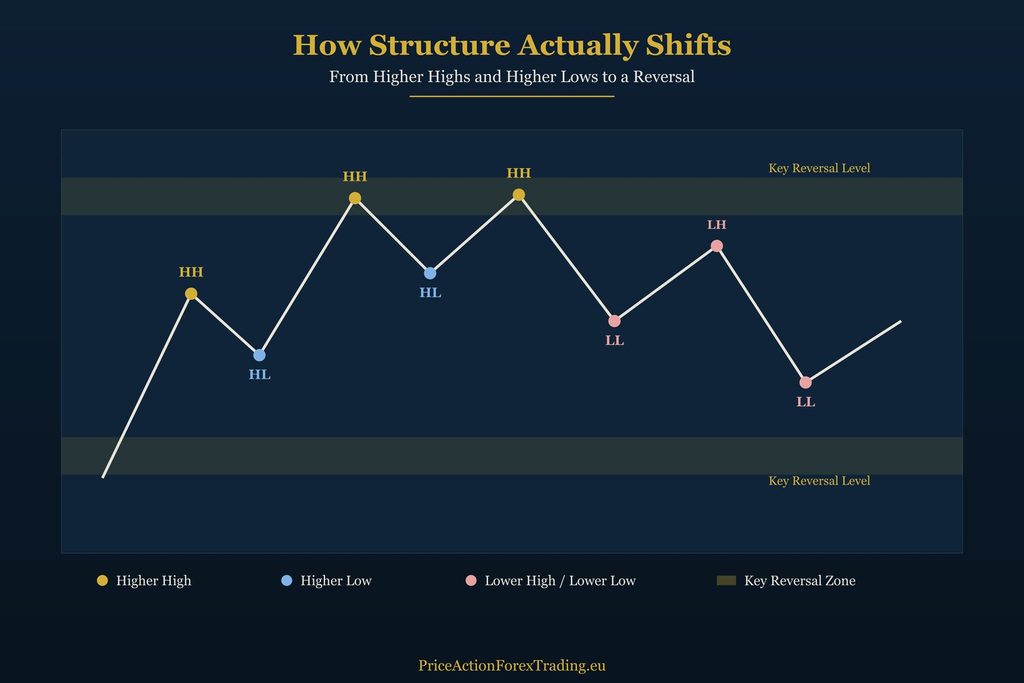
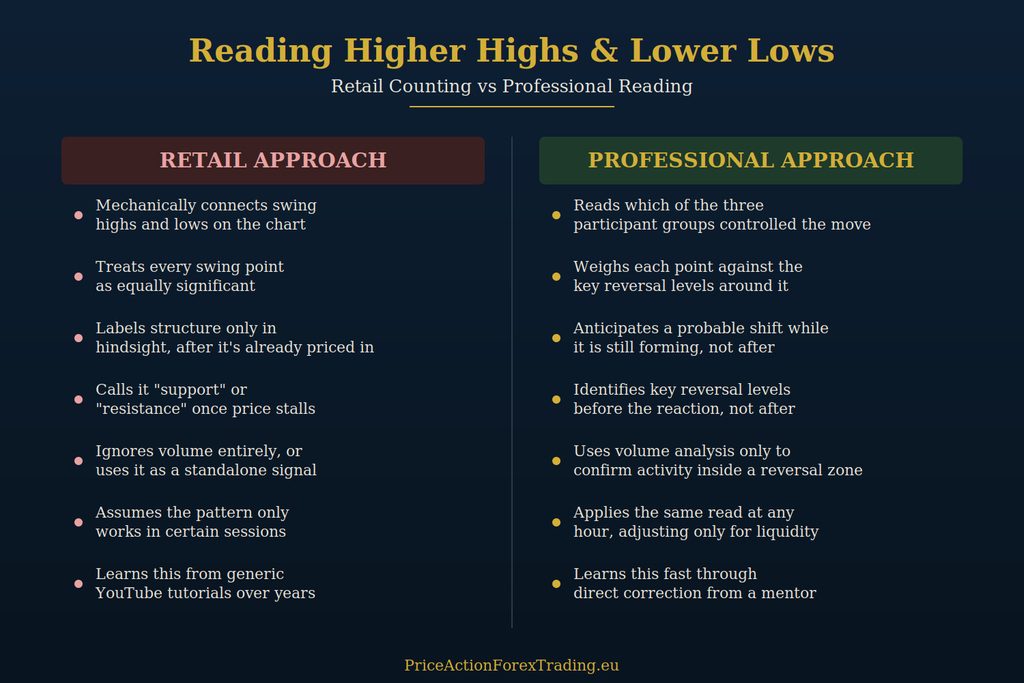
I also pay close attention to how the market has been building higher highs and higher lows, or lower highs and lower lows, in the price action leading up to a key reversal level. I go into this in more depth in my article on what higher highs and lower lows are actually telling you, but the short version is this: the structure leading into a level tells you far more about what’s likely to happen than the break itself does.
Volume Is Confirmation, Never a Signal on Its Own
A lot of retail breakout systems lean heavily on volume spikes as proof that a move is real. I use volume too, but only as confirmation inside a key reversal zone, never as a standalone reason to enter. Volume tells you activity increased. It doesn’t tell you which of the three groups caused that activity, or why. Treating a volume spike as a signal by itself is how traders end up entering directly into a liquidity sweep, which is the single most common way breakout trades go wrong.
Inside a key reversal level, once I already have Professional Alignment pointing in a direction, a shift in volume can add weight to that read. Outside of a proper zone, it means very little on its own, and I ignore it completely at that point. Of course, in any case, a trader needs professional knowledge to read the volume shifts correctly. They all carry a different meaning depending on what kind of volume change happened exactly.
How I Actually Time the Entry
This is the part that surprises most traders I mentor. I don’t wait for a candle to close beyond a level and then chase the move. By the time that candle has closed, the professional entry has usually already passed, and you’re buying into the same liquidity event that just cleared out the traders who were positioned too early.
Instead, I’m watching for the professional entry to develop at the tip of the key reversal level, often before the candle has even finished forming. If that candle later happens to close looking like a pin bar or some other shape from a retail pattern list, that’s coincidental. The shape isn’t the signal. The professional entry method is the signal, and the resulting candle shape is just what’s left behind once that method has already been applied. This is a completely different way of reading price than waiting for confirmation after the fact, and it’s one of the core things I work through with the traders I train directly.
Breakouts Work at Any Time, Not Just Certain Sessions
One thing I want to be clear about: a properly read key reversal level and a genuine Professional Alignment can appear during any session, at any hour. I don’t teach my traders to only look for breakout setups during London or New York hours, because the underlying method isn’t session-dependent. What does change from session to session is liquidity – how much volume is available to support a move once it starts. A breakout during a thinner session can still be entirely valid; it simply means you should expect the move to develop with less depth behind it, not that the setup itself is somehow less legitimate.
This is a common misconception that gets repeated across retail forums: the idea that certain strategies only “work” during specific windows of the day. The professional strategy itself doesn’t change. Only the amount of liquidity backing the move does (but not necessarily).
What a Genuine Key Reversal Level Actually Looks Like
Traders often ask me how to tell a key reversal level apart from an ordinary line drawn across old highs and lows. The honest answer is that it takes proper training to see it reliably, but I can describe the shape of it. A genuine key reversal level isn’t defined by a single touch or a round number. It’s defined by how the three groups of market participants have behaved in that price area across multiple visits, and whether the story told by price action leading into it is consistent with what happens once price arrives there again.
This is also why market structure is so difficult to read in real time without professional understanding. It’s usually obvious once you look back at a chart with hindsight, but identifying it while price is still forming is a different skill entirely, and it’s the part most retail definitions skip over completely. A key reversal level only becomes useful once you can read it as price is developing, not after the candle has already closed and the opportunity has passed.
Common Mistakes I See Traders Make With Breakouts
The most common error is entering purely because price closed beyond an obvious line, with no read on which market participants were actually driving that move. The second most common is treating every retest of a broken level as automatic confirmation, when in reality a retest into a heavily used level is often just the second half of the same liquidity event playing out.
The third mistake, and probably the most damaging long term, is trading breakouts in isolation from everything else on the chart. A breakout doesn’t exist in a vacuum. It only means something in the context of the trend, the key reversal levels around it, and whether the story the price action is telling lines up across those pieces. Trading a breakout signal on its own, disconnected from that broader picture, is exactly why so many traders describe this strategy as unreliable. It isn’t the strategy that’s the problem. It’s trading it without the professional understanding that makes it work.
Why This Requires a Different Kind of Training
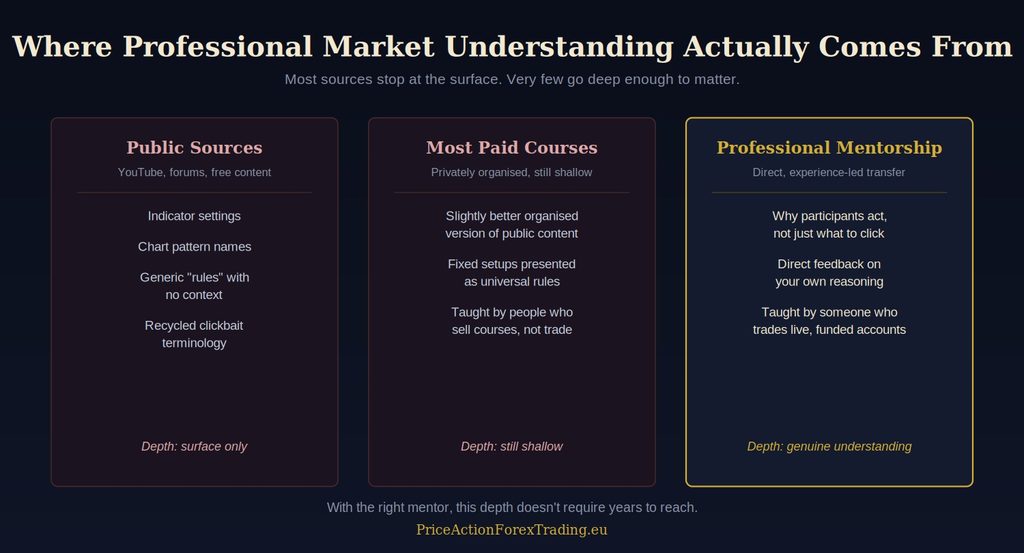
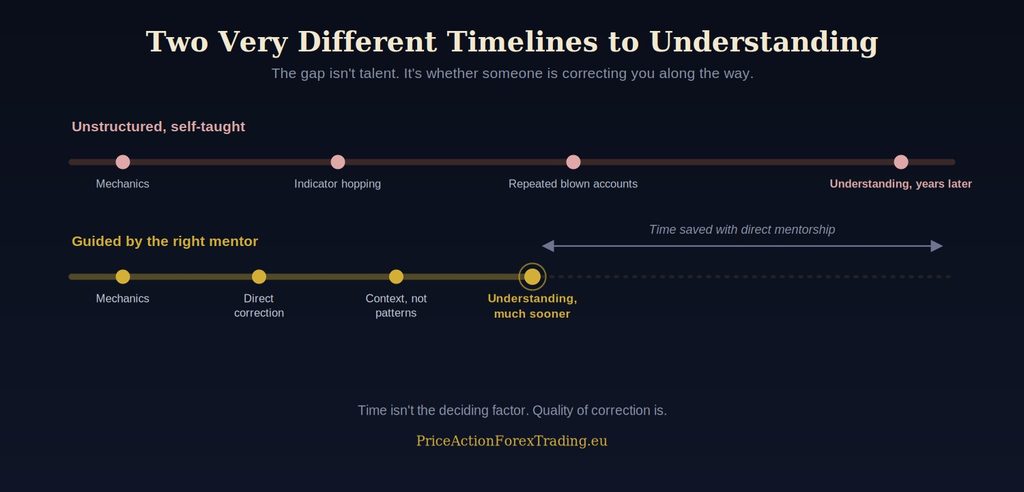
I didn’t figure any of this out from a retail course or a YouTube channel. I learned to read breakouts this way through direct training from my mentor, and the shift in how I saw these setups happened far faster than I expected going in. Once you’re shown how to actually identify the three groups of market participants and read a key reversal level properly, breakout trading stops being a coin flip and starts being something you can read with real confidence, often within the same day you’re shown how.
That’s a large part of why I built my Learn to Trade in 5 Days course around this exact kind of professional understanding rather than another list of retail patterns to memorize. It’s a complete, standalone way of learning to read the market properly, not a taster course meant to funnel you into something else. If you want the fuller picture beyond a single strategy, my Forex Training Course covers the broader framework I use across every type of setup, breakouts included.
Bringing It Together
Breakout trading isn’t a broken strategy. It’s a strategy that gets taught badly, using obvious lines that every retail trader can see and act on at the same time. Once you stop looking at breakouts as a line to wait for and start looking at them as a moment where you can read which market participants are actually in control, the entire setup changes. You stop chasing closed candles and start entering where the professional edge actually exists – before the shape has even finished forming.
That shift doesn’t happen by staring at more charts on your own. It happens through proper training, applied directly, from someone who can read what you can’t yet see.
Thanks for reading and have a beautiful day!