
If you’ve spent any time searching for the “best timeframe for price action forex,” you’ve probably found a dozen different answers. Some traders swear by the 15-minute chart. Others say the daily is the only chart worth looking at. Scalpers will tell you the 1-minute chart is where the real action happens.
I want to save you the years I spent chasing that question the wrong way. There is no single timeframe that will fix your trading. The timeframe you use matters far less than what you’re actually reading on it – and that’s the part almost nobody talks about.
In this article I’ll walk you through how I actually think about timeframes, why the “best timeframe” question is framed wrong from the start, and how to pick a chart (or charts) that fit the way you want to trade.
Why “Best Timeframe” Is the Wrong Question
Every retail trader eventually goes through the same phase. You start on the 5-minute chart because it feels exciting. Then you get chopped up by a string of losses, so you move to the 15-minute. Still not working, so you try the hourly. Then someone online tells you the daily chart is where “the smart money” trades, so you switch again.
None of these switches fix anything, because the problem was never the timeframe. The problem is what you’re looking for on the chart. Price action isn’t a chart setting you can dial in – it’s a way of reading what price is actually doing at a given moment, and that reading either holds up or it doesn’t, regardless of which timeframe you’re staring at.
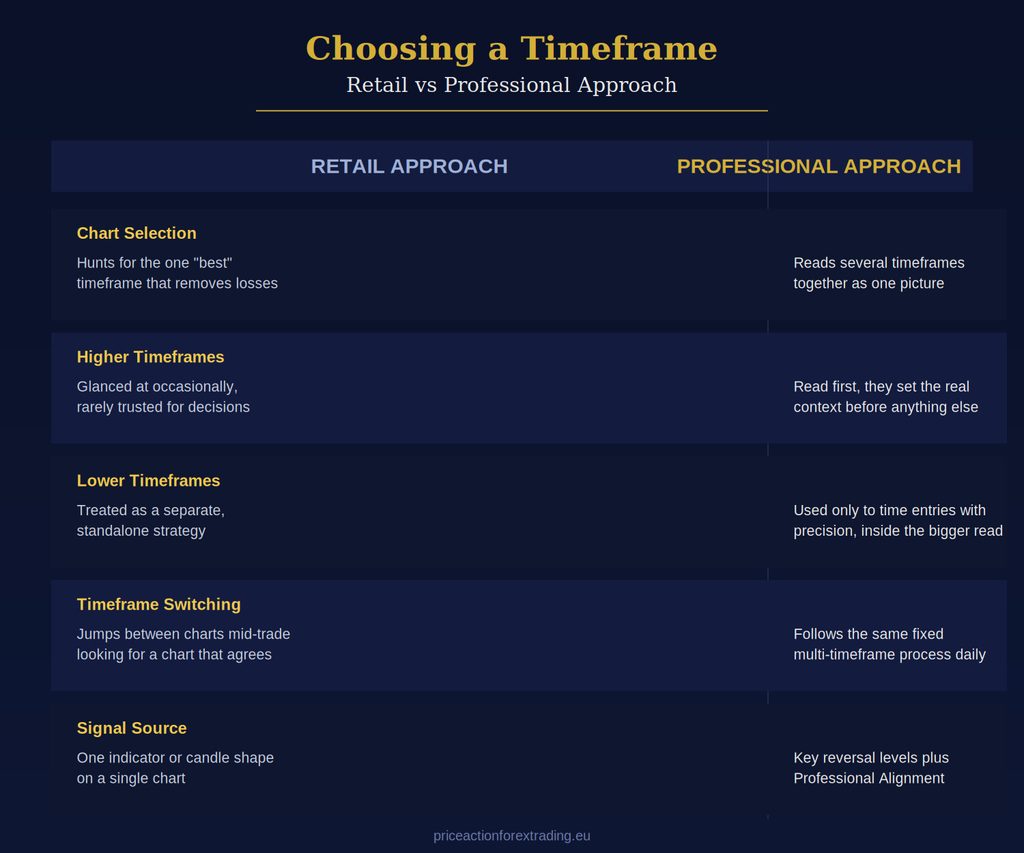
A key reversal level on the 4-hour chart is still a key reversal level when you zoom into the 15-minute chart. What changes is the resolution you’re viewing it at, not whether it’s meaningful. Retail traders treat timeframes like separate universes with separate rules. Professionals treat them as different zoom levels on the same map.
What a Timeframe Actually Changes (and What It Doesn’t)
Zooming in or out doesn’t change the market. It changes how much detail you see between two points in time. The daily chart compresses a week of price movement into five candles. The 1-minute chart stretches that same movement across hundreds of candles.
What stays constant is the structure. A key reversal level that price respects on the daily chart didn’t appear because of the daily chart – it exists because of how the three groups of market participants are actually behaving at that price. Zooming in only lets you see the finer detail of how price approaches that same level.
This is exactly why chasing a “best timeframe” misses the point. You’re not looking for a timeframe that magically produces winning signals. You’re looking for a resolution that lets you see the read you’re already making with enough precision to act on it.
Higher Timeframes: What They’re Actually Good For
H1 and H4 are where I always start. Not because “higher timeframe is always better,” but because this is where the most significant key reversal levels tend to be visible, and where a professional read of the current situation actually holds weight.
Here’s what higher timeframes are genuinely useful for:
- Context. Before I even think about an entry, I need to know where price sits relative to the levels that actually matter. That picture only comes from H1 and H4.
- More weight behind the reaction. Higher timeframes aren’t “cleaner” or less cluttered than lower ones – every candle carries real information regardless of the chart you’re on. What makes H1 and H4 matter more is that more money is actually moving through the key reversal levels visible there, which is what gives the reaction at those levels more weight when price finally reaches them.
None of this means H1 or H4 alone gives you a complete trading plan. It gives you the frame everything else has to fit inside. If you want a broader look at how I read where price is actually heading before I ever think about timing, I’ve written about that in how to identify trend in forex.
Lower Timeframes: Where Precision Comes From
Lower timeframes – the 15-minute, 5-minute, and 1-minute charts – are not where I decide what to trade. They’re where I decide exactly when.
Once a key reversal level has been read on a higher timeframe and I have genuine reason to expect price to react there, the lower timeframe lets me watch that reaction unfold in detail. I can see price approach the level with far more resolution than the 4-hour chart would ever show me.
This is the piece most retail traders get backwards. They treat the lower timeframe as its own independent strategy – a separate chart with its own signals, its own indicators, its own decisions made in isolation from anything happening above it. That’s how you end up taking a “signal” on the 5-minute chart that runs directly against what’s actually happening on the daily chart.
Used correctly, the lower timeframe doesn’t generate the decision. It refines the timing of a decision that was already made further up.
Multi-Timeframe Alignment: How I Actually Approach It
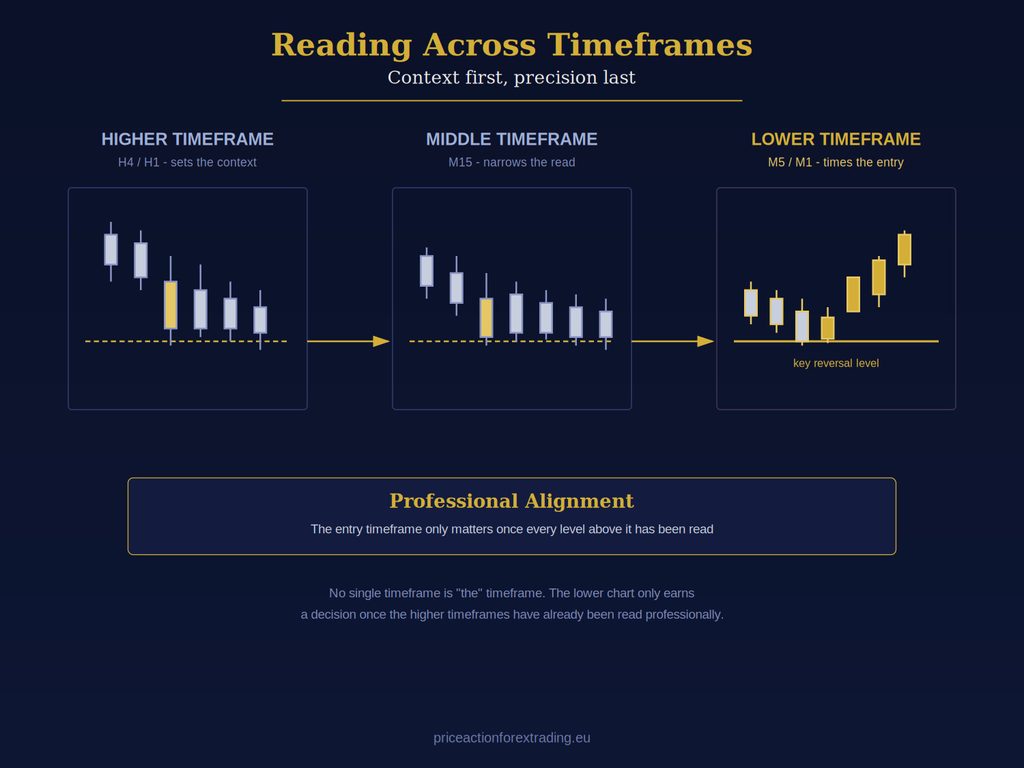
This is the part that actually matters, and it’s the part almost nobody teaches properly. I don’t pick “a timeframe.” I read several timeframes together, and I only act when what I’m seeing lines up across them – what I call Professional Alignment.
Here’s roughly how that process works in practice:
- Start on H1 or H4. I identify the key reversal levels that are genuinely significant right now, and I form a professional read of where price is actually likely to go.
- Move down to a middle timeframe. This narrows the picture. I’m watching how price is behaving as it approaches the level I identified above, without yet making any decision.
- Drop to a lower timeframe for timing. Only once the level is close, and only once the read from the higher timeframes is intact, does the lower timeframe come into play – purely to time entry with precision.
Indicators can be part of that last step, but only as the final confirmation applied after the level has already been read professionally. Reading what retail traders typically see on those same indicators, and what decisions they typically make from that reading, is itself valuable information that feeds into how I approach the level – a subject I go into in more depth in price action vs indicators in forex.
Professionals aren’t infallible in this process. Sometimes price behaves in a way that even a genuine professional read didn’t fully anticipate. What’s far more common, though, is retail traders joining a move after professionals have already positioned themselves – not the other way around. That’s part of why the higher timeframe read has to come first: it’s the only way to have any real sense of who’s likely already positioned before you commit.
Timeframe and Trading Style: Scalping, Day Trading, Swing Trading
Your trading style genuinely does influence which timeframes you’ll spend the most time on, even though the underlying process of reading key reversal levels and waiting for Professional Alignment stays the same.
Scalping isn’t defined by the clock the way most retail content presents it. I don’t measure a scalp by how many minutes it stays open – I measure it by the target. A scalp is built around a tight, specific profit target, and if price takes its time getting there, the trade can stay open for days rather than closing in minutes. What makes it a scalp is the size of the move you’re aiming to capture, not the duration. Entries are still timed on the 5-minute and 1-minute charts, with the levels identified on H1 or H4 first. Scalping isn’t a shortcut around reading price properly – if anything, it demands faster, more precise reads because there’s less room for error. I cover this in detail in Learn to Scalp in 5 Days, which walks through exactly how that timing process works.
Day trading typically means working across the 15-minute to 1-hour range, closing positions before the day ends. This gives you slightly more breathing room than scalping while still requiring you to be actively watching the market.
Swing trading stretches out to the 4-hour and daily charts, holding trades for days rather than hours. This suits traders who can’t sit in front of a screen all day, since the structure develops more slowly and doesn’t demand constant attention.
None of these styles is inherently “better.” They suit different lifestyles and different amounts of available screen time. What doesn’t change between them is the underlying skill: reading key reversal levels professionally and waiting for genuine alignment before acting. A professional approach isn’t restricted to particular hours or sessions either – the process works at any time of day, though liquidity naturally shifts depending on which markets are active.
Common Mistakes Retail Traders Make With Timeframes
I made most of these mistakes myself early on, so I recognize them instantly when I see other traders making them.
- Timeframe shopping. Switching charts until you find one that “agrees” with the trade you already wanted to take. This isn’t analysis, it’s confirmation bias wearing a different chart.
- Ignoring the higher timeframe entirely. Trading purely off a 5-minute chart without any sense of where the bigger picture stands is one of the fastest ways to get caught trading directly against the real direction of the market.
- Treating the lower timeframe as a separate system. As I mentioned above, the lower timeframe chart isn’t where decisions get made – it’s where they get timed.
- Expecting a timeframe to compensate for a lack of genuine understanding. No chart resolution replaces an actual professional read of key reversal levels. If the foundational skill isn’t there yet, changing timeframes just changes what the mistake looks like.
If any of this sounds familiar, it’s worth reading how to learn forex trading without wasting years on the wrong things, since timeframe hopping is usually a symptom of a bigger gap rather than the actual problem.
How to Choose Your Timeframe
Rather than asking “what’s the best timeframe,” ask yourself these questions instead:
- How much time can I realistically dedicate to watching a screen? If it’s limited, swing trading on higher timeframes will suit you far better than scalping.
- What pace do I actually enjoy? Some traders find the pace of the daily chart frustrating. Others find scalping stressful. Trading in a style that fights your temperament is a recipe for poor decisions under pressure.
- Am I prepared to read multiple timeframes, not just one? If the honest answer is no, that’s worth addressing before anything else, because a single-timeframe approach will always be missing context the market is actually giving you elsewhere.
There’s no shortcut that skips learning to read price properly at every zoom level you plan to trade from. The good news is that this isn’t something that has to take years to develop. Under the right training, this kind of professional understanding can be built quickly – it’s a matter of learning to see what’s actually there, not accumulating screen-time hours.
Final Thoughts
The best timeframe for price action forex isn’t a specific chart. It’s whichever combination of timeframes lets you read key reversal levels for context and time your entries with precision, in a style that actually fits your life. Higher timeframes tell you what’s genuinely significant. Lower timeframes tell you exactly when to act on it.
If you want to build that skill properly rather than guessing your way through chart after chart, my Forex Training Course walks through the entire process, and Learn to Trade in 5 Days is a complete, standalone course you can start applying immediately.
Thanks for reading and have a beautiful day!