
I get asked this constantly, usually in one of two ways. Either “is price action just another word for candlestick patterns?” or “which one should I actually learn?”
Both questions come from the same place. Most educational content online treats these as interchangeable, so traders end up memorizing a list of candle shapes and calling that “price action trading.” Then they wonder why the shapes don’t work.
They’re not the same thing. One is a small, mechanical piece of chart reading. The other is the entire discipline that piece sits inside of. Confusing them is one of the most common reasons retail traders stay stuck for years, so let’s actually separate them properly.
What Price Action Really Means
Price action, at its core, is the practice of reading a chart using nothing but the price itself, no indicators, no oscillators, no lagging overlays. I’ve written a full breakdown of what this actually looks like in practice over here, but the short version is this: price action is about understanding what’s happening in the market by looking directly at how price has behaved and where it’s positioned now.
That’s a much bigger job than spotting a shape. Genuine price action reading involves:
- Where price sits relative to key reversal levels
- How price has approached those levels historically
- What kind of behaviour has followed similar approaches before
- Whether there’s Professional Alignment building around the current position
None of that requires a single named candle. You could read all of it from a completely blank chart with no candles at all, just a line. That’s the point. Price action is a reading skill, not a shape-spotting skill.
What Candlestick Patterns Actually Are
Candlestick patterns are a specific, narrow tool that retail education has built an entire industry around. Pin bars, engulfing candles, dojis, hammers, shooting stars, morning and evening stars. Each one gets its own name, its own diagram, and its own “here’s what it means” explanation in every beginner course.
The retail pitch is simple: learn to recognize these shapes, and you’ll know when the market is about to turn or continue. I’ve gone through several of these individually already, pin bars, engulfing candles, inside bars, and the conclusion is always the same. The shape on its own tells you almost nothing.
I put together a broader look at this across the whole category in this article, if you want the full picture on why “patterns that work” is the wrong question to even be asking.
The Actual Difference: A Word vs a Sentence
Here’s the cleanest way I can put it. A candlestick pattern is a single word. Price action is the whole sentence, with grammar, context, and meaning attached.
You can memorize the word “bank” perfectly. But without the sentence around it, you have no idea if someone’s talking about a financial institution or the side of a river. The word alone is meaningless until it’s placed in context.
That’s exactly what happens when a trader spots a “bullish engulfing candle” in isolation. The shape appeared. Fine. But appeared where? After what kind of move? Near what kind of level? With what else lining up around it? Without those answers, the shape is just a word floating with no sentence around it, and trading it blind is how most retail accounts get chipped away one small loss at a time.
Why This Confusion Costs Traders Real Money
This isn’t a philosophical distinction I’m making for the sake of being pedantic. It has a direct, measurable cost.
When a trader treats a candlestick pattern as the actual signal, they’re skipping every step that would tell them whether that pattern means anything at all. They see a hammer candle and buy, because a course told them hammers signal reversals. They don’t check where it printed. They don’t consider what’s been happening in the market leading up to it. They just see the shape and act.
The market prints these named shapes constantly, on every timeframe, all day long, in every currency pair. If the shape itself was a reliable signal, retail traders using this approach would be consistently profitable. They’re not, and the reason isn’t bad luck. It’s that the piece they’re trading was never designed to work alone.
I see this play out the same way over and over. A trader takes a small string of losses on a strategy built entirely around named shapes, so they go looking for a “better” pattern, or a filter to add on top, like only trading the shape on a higher timeframe, or only trading it during a specific session. None of these fixes address the actual problem. They’re all still variations of trading the shape first and asking questions later, just with an extra rule bolted onto the outside of the same flawed process. The shape was never the problem to begin with, and no amount of filtering around it changes what it fundamentally is.
Where a Candlestick Pattern Actually Fits
This doesn’t mean candle shapes are completely irrelevant. They’re just not where the analysis starts, and they’re never the deciding factor on their own.
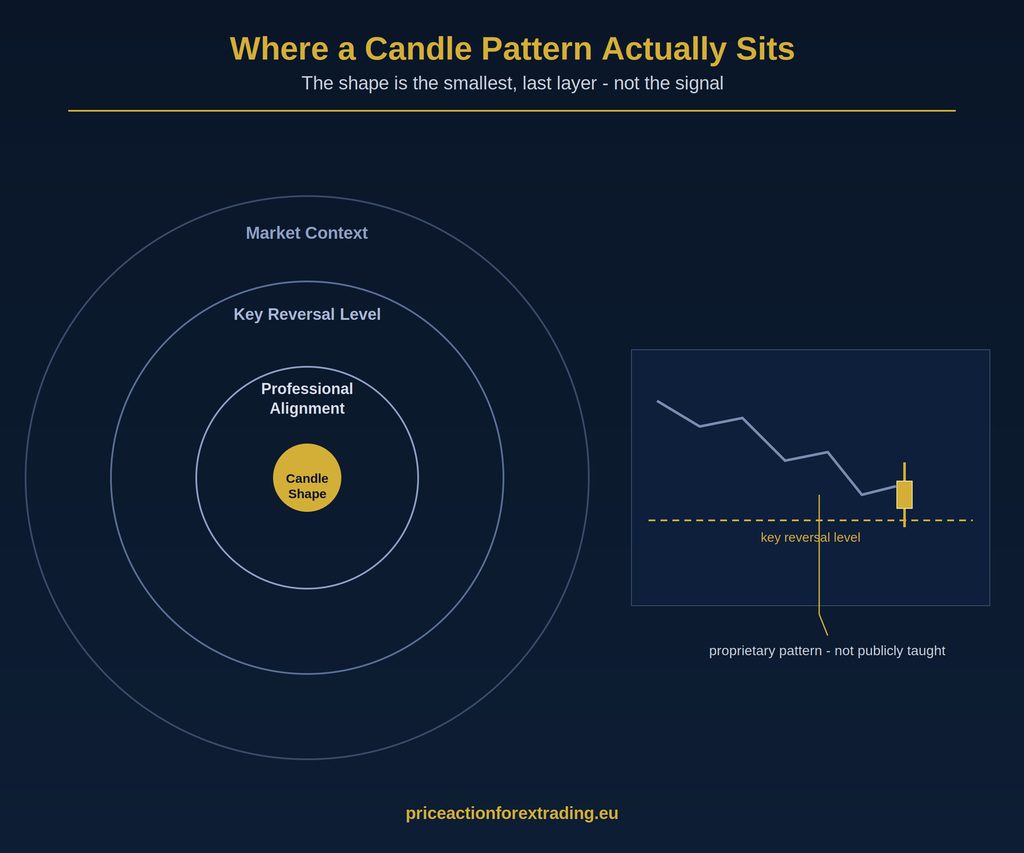
In genuine professional reading, a candle shape is the smallest, last layer you’d ever look at, if you look at it at all. The layers that actually matter, in order, are the wider market context, whether price has reached a genuine key reversal level, and whether Professional Alignment exists at that level. The candle shape sits at the very center, and by the time you’ve properly read everything around it, the shape itself has told you almost nothing new.
I don’t enter trades based on any of the publicly named patterns. What I actually trade are patterns developed through direct training with my mentor, patterns that aren’t taught publicly and aren’t something I go into detail on here. That training is reserved for people going through the Forex Training Course, because it’s not something that translates well to a blog post. What I can tell you is that the difference isn’t a slightly better shape. It’s a completely different relationship with the chart.
Retail Focus vs What Actually Matters
The comparison is stark once you lay it out side by side.
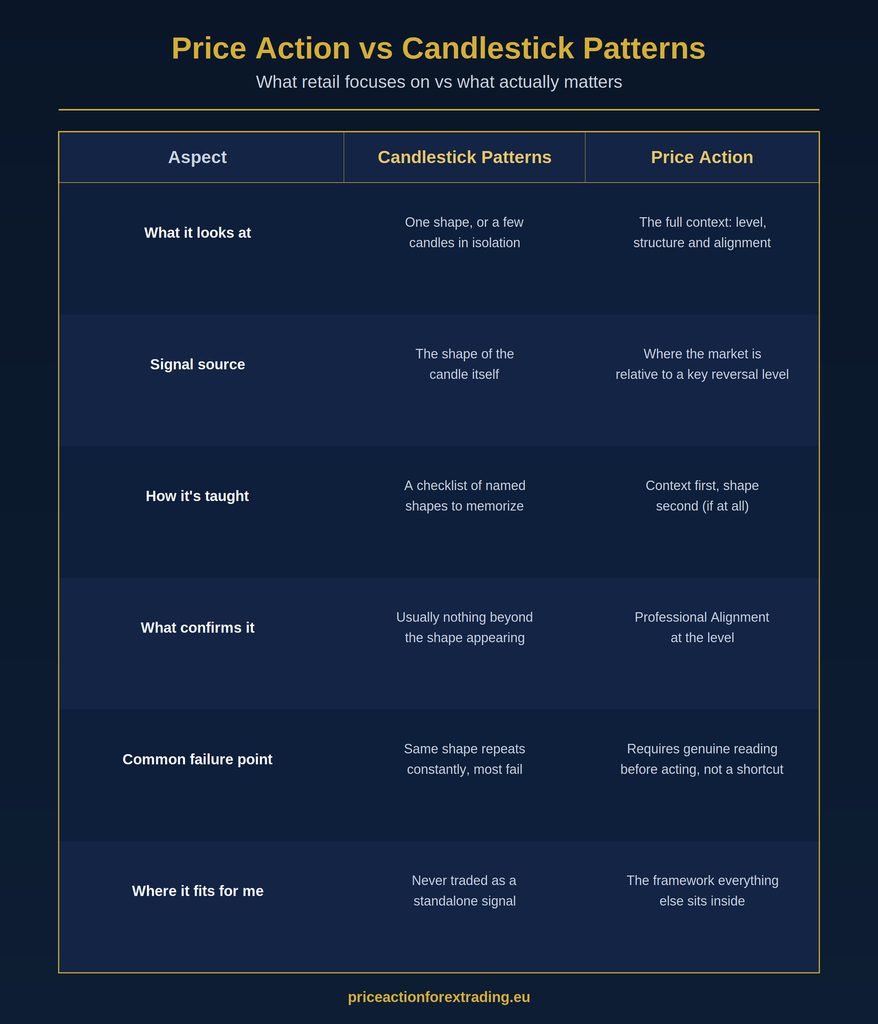
Retail traders learn candlestick patterns as a checklist. Spot the shape, match it to the textbook definition, take the trade. It feels systematic, which is exactly why it’s appealing to someone starting out. It gives the illusion of a repeatable process without requiring any genuine understanding of the market underneath it.
Professional reading flips the order entirely. Context comes first. The shape, if it’s even considered, comes last, and only ever as one small piece inside a much larger picture that’s already been read correctly before the shape shows up.
Why “Price Action Trading” Got Reduced to Pattern Spotting
If price action is genuinely this much broader, why does almost every beginner resource reduce it to a list of ten candle shapes?
Simplicity sells. A named shape with a picture is easy to package into a course, easy to put in a PDF, easy to test someone on with a quiz. “Here are ten shapes, memorize them” is a product you can build and sell in a weekend. “Develop a genuine understanding of how price behaves at levels” is not something that fits neatly into a checklist, so it doesn’t get taught that way in most public content.
There’s also a search-engine effect at play here, and it’s worth naming directly. “Candlestick patterns” and “price action” both get searched heavily, and content creators know that a post titled “Top 10 Candlestick Patterns You Need to Know” will rank and get clicked far more reliably than a post trying to explain genuine market reading. So the internet fills up with pattern lists, each one recycling the same handful of shapes with slightly different wording, and newer traders assume that volume of content equals validity. It doesn’t. It just means the easy version got produced ten thousand times over, while the harder, more accurate version got produced rarely.
This is also why so much of what’s labeled “price action strategy” online is really just candlestick pattern trading wearing a different name. Swap the word “candlestick” for “price action” in a title, keep the exact same pattern list underneath, and you’ve got a piece of content that sounds more sophisticated without actually teaching anything different. The market doesn’t reward memorized checklists, which is a big part of why so many traders spend years going in circles without ever getting anywhere close to genuine competence, no matter how many pattern guides they’ve read.
What Actually Reading Price Action Looks Like
If patterns aren’t the foundation, what is? It comes down to a few genuine skills that take direct training to build properly.
First, understanding key reversal levels, not as lines you draw with a ruler, but as areas where genuine turning behaviour has repeatedly shown up. Second, reading how price is behaving as it approaches those levels, which requires actual market understanding rather than a rulebook. Third, recognizing Professional Alignment when multiple things line up in the same direction at the same level, rather than acting the moment one thing looks interesting.
None of this happens overnight through self-study alone, and I’m not going to pretend otherwise. But it also doesn’t require years of trial and error, which is the other extreme a lot of guru content pushes. Under the right mentor, with direct training, this kind of understanding can develop genuinely fast. That’s exactly the structure behind Learn to Trade in 5 Days, a complete standalone course built specifically to get you reading price properly rather than handing you another list of shapes to memorize.
A Quick Way to Test Yourself
Here’s a simple gut check. Look at any candle pattern you’ve been taught to trust, a pin bar, an engulfing candle, whatever it is. Ask yourself: could I explain why this particular one matters without mentioning the shape at all?
If your answer leans entirely on “because it’s a pin bar” or “because it’s engulfing,” you’re trading the word without the sentence. If you can point to the level, the context, and the alignment around it, independent of what the candle looks like, you’re already thinking in the right direction.
Most retail traders can’t answer that question without falling back on the shape, because the shape is all they were ever taught to look for. That’s not a knock on them individually. It’s a gap in how this subject gets taught publicly, and it’s the exact gap I built this site to close.
I’d also push back gently on one common workaround I see traders try: adding indicators on top of pattern spotting to feel more confident about a shape. A moving average, an RSI reading, a volume bar. None of these fix the underlying issue, because they’re still being layered onto a signal that was never the actual signal in the first place. Volume, when it’s used at all in genuine reading, only ever confirms a level that’s already been read correctly beforehand. It’s never a standalone trigger, and neither is any other indicator bolted onto a candle shape after the fact.
Bringing It Together
Price action and candlestick patterns aren’t the same thing, and treating them as interchangeable is probably costing you more than you realize. Price action is the discipline of reading the market genuinely, through key reversal levels, context, and Professional Alignment. Candlestick patterns are one small, optional, last-in-line detail inside that discipline, never the discipline itself.
If you’ve been trading named shapes and wondering why results haven’t followed, this is likely the reason. The fix isn’t a better pattern. It’s building genuine market understanding around the patterns you were told mattered, and learning to see everything that actually surrounds them.
Thanks for reading and have a beautiful day!