Articles

Engulfing Candle Forex Strategy: Why the Shape Isn’t the Edge

If you search “engulfing candle forex strategy” you’ll find hundreds of articles telling you the same thing: spot a big green candle swallowing a small red one, and you’ve found your signal. Enter on the close, set your stop below the low, done.

I traded that way for years. It never worked consistently, and it wasn’t because I was reading the shape wrong. It’s because the shape was never the thing that mattered in the first place.

In this article I want to walk you through what an engulfing candle actually is, why the retail version of this “strategy” keeps failing traders who execute it perfectly, and what I actually look for when one shows up on my charts. If you’ve read my article on what price action actually is, you already know where I’m going with this: it’s never the pattern in isolation, it’s what the pattern is telling you about who’s actually moving the market.

What an Engulfing Candle Actually Is

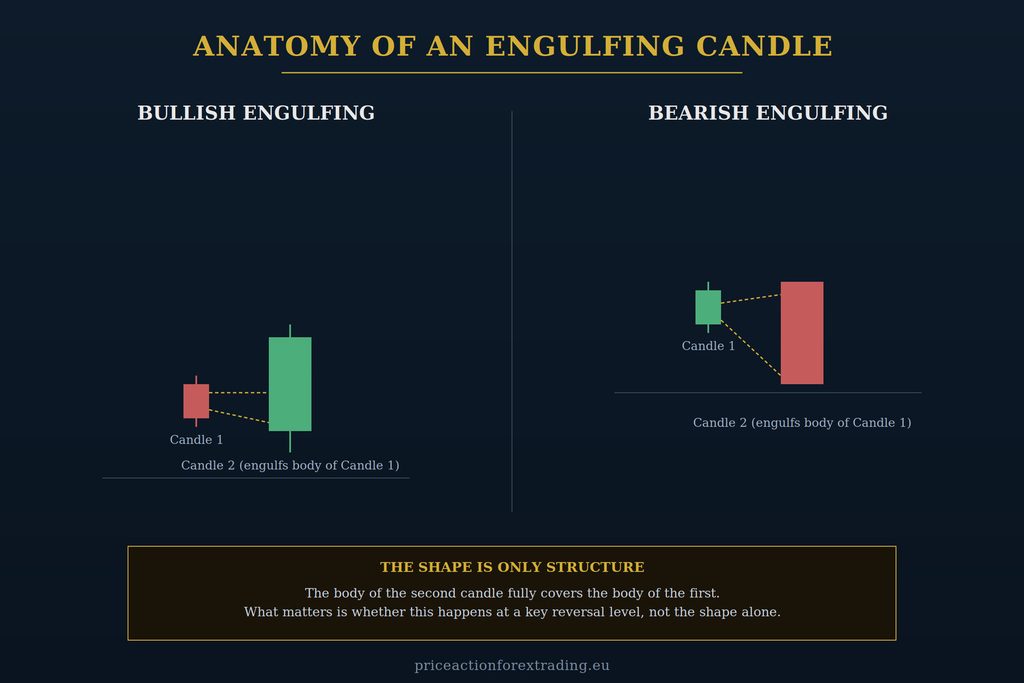
Mechanically, it’s simple. A bullish engulfing candle forms when a candle’s body fully covers the body of the candle before it, closing higher than the prior candle opened. A bearish engulfing candle is the mirror image: a large down candle whose body swallows the smaller up candle that preceded it.

That’s it. That’s the entire definition. No indicator, no lagging confirmation, nothing fancy. You can see it happen in real time as the second candle forms and closes beyond the range of the first candle’s body.

Where things go wrong is in what traders are taught to do with that information the moment they see it.

The Retail Version of This Strategy

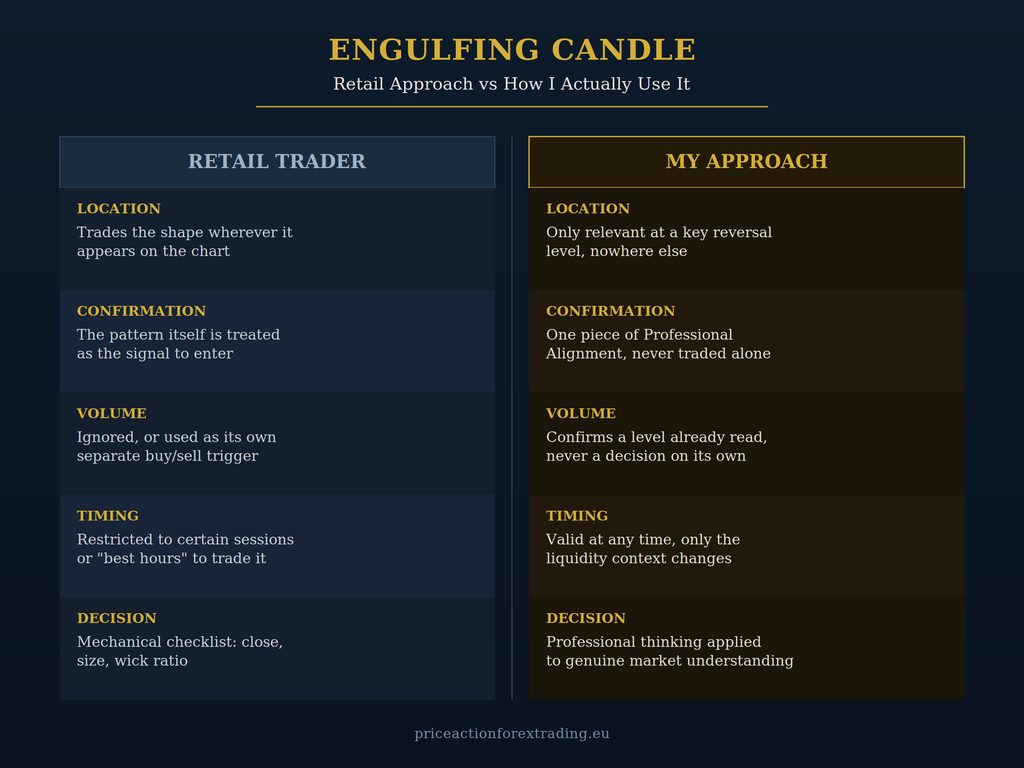
Most educational content treats the engulfing candle as a standalone entry signal. The instructions usually look something like this: wait for the pattern to close, check that the body is a certain size relative to the prior candle, maybe glance at an oscillator for extra confirmation, then enter.

The problem isn’t that this process is complicated. It’s that it treats a candle shape as though it has meaning independent of where it forms. An engulfing candle in the middle of a random stretch of price and an engulfing candle at a genuine turning point look identical on a chart. Retail methodology can’t tell the difference between them because it was never designed to. It’s pattern recognition, not market reading.

This is the same mistake I see across almost every popular “strategy” retail traders are taught, whether it’s continuation patterns, breakouts, or pullbacks. The shape gets treated as the signal. It never is.

What the Engulfing Candle Is Actually Telling You

An engulfing candle is a readable event. Within a single session, price moved decisively enough in one direction to erase and overtake the entire range of the prior candle. That’s not nothing. But what it tells you depends entirely on the context it happens in.

The market moves the way it does because of the three groups of market participants active in it at any given time, and how their behaviour is currently aligned. I won’t get into the specifics of who those groups are or how I read their behaviour here. That’s the core of what I teach directly, and it’s the part that took me years of working alongside a professional mentor to genuinely understand rather than fake with rules and checklists.

What I can tell you is this: an engulfing candle only becomes meaningful when it forms at a key reversal level. Not a line I drew because price touched it twice. A level built from genuine understanding of where these participant groups are likely to act. When an engulfing candle forms there, it’s a piece of evidence, one part of what I call Professional Alignment, which is the convergence of several things pointing at the same conclusion before I’ll actually take a trade.

Away from a key reversal level, the exact same candle shape is just noise dressed up as a signal. It’s not that the price data is meaningless there, it’s that this particular structure isn’t telling you what retail educators claim it’s telling you.
Where Volume Fits In

A lot of engulfing candle content leans on volume as a secondary confirmation tool: big candle, big volume, must be real. I understand the appeal of that logic, but it’s backwards in how it’s usually applied.

Volume doesn’t tell you a level is good. Volume confirms a level I’ve already identified through genuine reading of participant behaviour. It’s supporting evidence for a read I’ve already made, never a standalone trigger that turns an ordinary candle into a valid one. If you’re using volume to decide whether to trade an engulfing candle rather than to confirm a decision you’ve already reached, you’re using it the wrong way round.

Why “Bigger Is Better” Isn’t the Right Filter

Another common rule is to only trade engulfing candles above a certain size, on the logic that bigger equals stronger. Size on its own tells you very little. A large engulfing candle in the wrong location is still in the wrong location. A modest one that forms exactly at a key reversal level, aligned with everything else I’m reading in that moment, matters far more than a dramatic one sitting in open air.

This is where mechanical checklists fall apart. Professional trading isn’t a set of measurements you run through. It’s professional thinking, applied to genuine market understanding, in the moment a setup forms. That’s the part no checklist can replace, and it’s also the part that improves fastest under direct training rather than years of solo backtesting.

Engulfing Candles and Reversals

Because of their shape, engulfing candles get grouped almost automatically with reversal trading, and there’s a reason for that instinct. When I’m reading a potential reversal at a key level, an engulfing candle forming there can be exactly the kind of price behaviour I’d expect to see if my read on the participant groups is correct.

But it’s not a reversal signal by itself, any more than it’s a continuation signal by itself. The same shape can show up inside a trend, at the edge of a range, or after a pullback into a level. What determines whether it’s worth acting on isn’t the pattern category you’ve mentally filed it under. It’s whether it’s happening exactly where and how your reading of the market says it should.
Where This Fits Into a Bigger Structure

If you’ve spent time reading about key reversal levels on this site, this will sound familiar. Nearly every piece of price behaviour I care about, whether it’s a candle shape, a pullback, or a momentum shift, only becomes actionable in the context of a level I’ve already identified through genuine market reading. The engulfing candle is no exception. It’s one more piece of evidence that either supports or contradicts what I already believe is happening at that level.

This is why I never teach candle patterns as their own isolated topic. Treating an engulfing candle, a pin bar, or any other shape as a self-contained strategy misses what actually makes trading decisions reliable: the level it forms at, and the professional understanding of participant behaviour that made that level worth watching in the first place.

Common Mistakes I See With This Pattern

A few things come up repeatedly when I look at how retail traders apply engulfing candle setups.

The first is trading them anywhere they appear rather than restricting attention to levels that actually matter. If you’re marking every engulfing candle on your chart, you’re looking at dozens of “signals” a week, and the vast majority of them mean nothing.

The second is treating the close of the candle as an automatic trigger regardless of what else is happening. A candle closing beyond the prior range doesn’t override everything else you know about where price is and why.

The third is session restriction: the belief that this pattern only “works” during London or New York hours. It works, or doesn’t, based on whether the underlying conditions are right, not the clock. Liquidity context shifts through the day, but the read itself isn’t tied to a session window.

The fourth, and probably the most common, is expecting the pattern to be predictive on its own. It isn’t. It’s confirmatory, and only when everything else already points in the same direction.

Bullish vs Bearish Engulfing: Does the Direction Change Anything?

Not really, beyond the obvious. A bullish engulfing candle tells you buying pressure within that session was strong enough to erase the prior candle’s range and then some. A bearish engulfing candle tells you the same thing in the opposite direction. The mechanics are mirrored, and so is the analysis.

What doesn’t change between the two is the question that actually matters: where did it happen. A bullish engulfing candle forming at a key reversal level where I’d expect buying interest to show up is worth attention. The exact same bullish engulfing candle forming in the middle of an established move, away from any level I’ve identified, tells me very little beyond “buyers were active that session,” which on its own isn’t something I can build a trade around.

I’d caution against treating one direction as inherently more reliable than the other, too. I’ve seen traders convince themselves that bearish engulfing candles “work better” on a certain pair, or that bullish ones are more reliable during a particular part of the day. That’s usually a small sample size doing the talking – a self deception so to speak. The read doesn’t change with direction. Only the context you’re reading it in does.

Why Backtesting This Pattern Rarely Tells You Much

If you’ve ever tried to backtest engulfing candles as a standalone strategy, you’ve probably noticed the results are inconsistent at best. Some pairs, some periods, some timeframes show a slight edge. Others show none, or a negative one. This isn’t a data problem, and it isn’t a matter of needing a bigger sample size or a cleverer filter.

It’s because the pattern was never the variable that mattered. A backtest built purely around candle shape treats every engulfing candle as equivalent, when in reality the vast majority of them are just noise and a small minority form at genuinely significant moments. Mixing those together and running statistics on the combined set will always produce a muddy result, no matter how much historical data you feed it. You can’t backtest your way into professional market reading, because the thing that makes a setup valid isn’t mechanically identifiable from price and volume data alone. It requires the kind of understanding that comes from direct training, not from a spreadsheet.

How I’d Suggest You Approach It

If you want to actually use engulfing candles well, stop looking for them everywhere. Start by learning to identify genuine key reversal levels first, because without that step, nothing else here matters. Once you can find those levels reliably, watch how price behaves as it reaches them. An engulfing candle forming there, alongside other signs of Professional Alignment, is worth paying attention to. One forming in open space, no matter how large or dramatic, isn’t.

This is exactly the kind of thing that’s difficult to learn purely from articles, including this one. Reading about a level is not the same as developing the eye to spot one in real time, under pressure, with your own money on the line. That’s the gap direct training closes fastest. In my Forex Training Course, I walk through exactly how I read these situations, level by level, so you’re not guessing at which engulfing candles are worth your attention and which aren’t.

If you’d rather get there faster with a single focused approach, my Learn to Trade in 5 Days course teaches one complete method end to end, including how candle behaviour like this fits into a genuine professional read of the market. You don’t need years to get this right. Under the right training, this kind of understanding can click far faster than most traders expect.

Final Thoughts

The engulfing candle isn’t a bad tool. It’s a real, observable piece of price behaviour that genuinely means something, just not the thing most retail content tells you it means. Treated as a standalone signal, it’s noise with good marketing. Treated as one piece of evidence within a genuine read of key reversal levels and participant behaviour, it’s useful.

The difference between those two outcomes isn’t the candle. It’s everything you bring to reading it.

Thanks for reading and have a beautiful day!
Pin Bar Forex Strategy: Why the Shape of the Candle Was Never the Point

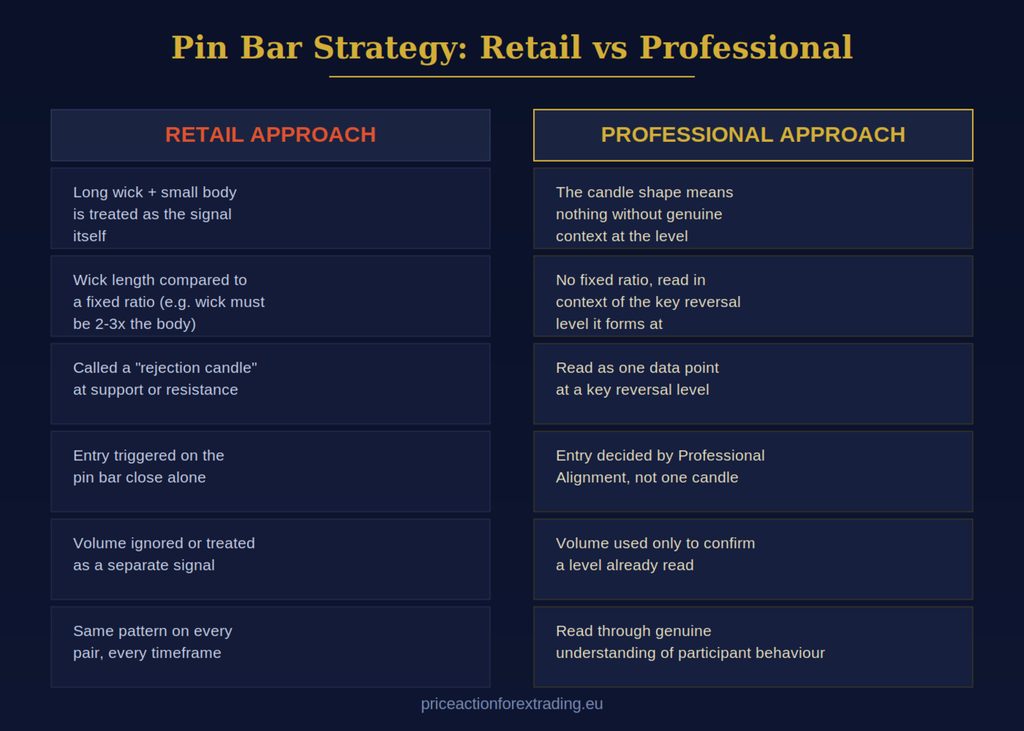
If you have spent any time reading about price action, you already know the pin bar. Long wick, small body, sitting at a level on your chart. Every course, every YouTube video and every forum thread teaches it the same way – measure the wick, check it is two or three times the size of the body, confirm it is sitting at support or resistance, and take the trade on the close.

I taught myself that version once too. It cost me money for a long time before I understood why.

The pin bar is one of the most recognisable candles in forex trading, and also one of the most misunderstood. Traders memorise its shape and treat that shape as a signal. It never was. What the wick and the body are actually telling you only makes sense once you understand what is happening at the level where the candle formed – and that is the part almost nobody teaches, because almost nobody who teaches it actually knows.

In this article I will walk through why the retail pin bar checklist fails so often, what I actually look at when a candle like this forms, and where it fits into a professional approach to reading price.

What Traders Are Taught About the Pin Bar

The standard definition goes something like this: a candle with a small real body and a long wick protruding in one direction, ideally with little to no wick on the opposite side. The long wick is supposed to show that price moved sharply in one direction and then closed back near where it opened.

From there, the checklist usually includes:

  • The wick must be a certain multiple of the body, often two or three times its length
  • The candle should form at an obvious support or resistance zone
  • A “confirmation candle” should follow in the expected direction
  • Entry is placed on the break of the pin bar’s high or low, stop behind the tip of the wick

None of this is wrong in the sense that it describes what the candle looks like. What is wrong is what it implies – that the shape itself is the reason to trade. That a long wick automatically means something happened that you can act on.

I have gone through what price action actually is in forex in detail elsewhere, and the pin bar is a perfect example of the gap between reading candles and reading price. Most traders think they are doing the second when they are only doing the first.

Why the Checklist Approach Fails

Here is the problem with treating a pin bar as a standalone signal. If a long wick with a small body was genuinely a reliable trigger on its own, it would work consistently across every pair, every session and every timeframe. It does not. Traders who trade every pin bar they see at every level they can draw a line at lose money, and they lose it in a fairly predictable way.

The candle shape is common. It happens constantly, in both directions, at levels that matter and at levels that do not. A retail trader scanning charts for pin bars is essentially pattern matching on noise, because the shape alone carries no information about why price moved the way it did before printing that wick.

This is the same mistake I see across almost every “pattern” retail traders are taught to hunt for. A shape on a chart is the visible residue of something that already happened. It is not the cause, and treating it as a trigger skips the part that actually matters.

Location Is Not Enough Either

Most pin bar education tries to fix the “shape alone isn’t enough” problem by adding location as a filter. Trade the pin bar only at support or resistance, they say. This is progress, but it is not the fix people think it is.

I have written before about how support and resistance zones actually get used by retail traders, and the same issue applies here. A pin bar forming at any random horizontal line drawn on a chart is not the same thing as a pin bar forming at what I call a key reversal level – a level that reflects genuine, structural significance in how the market has behaved around it.

Most of the horizontal lines retail traders draw are not that. They are reactive, hindsight-drawn levels fitted to where price has already turned once or twice. A pin bar at one of those levels is just as meaningless as a pin bar in the middle of nowhere, because the level itself was never meaningful to begin with.

What a Pin Bar Actually Tells You

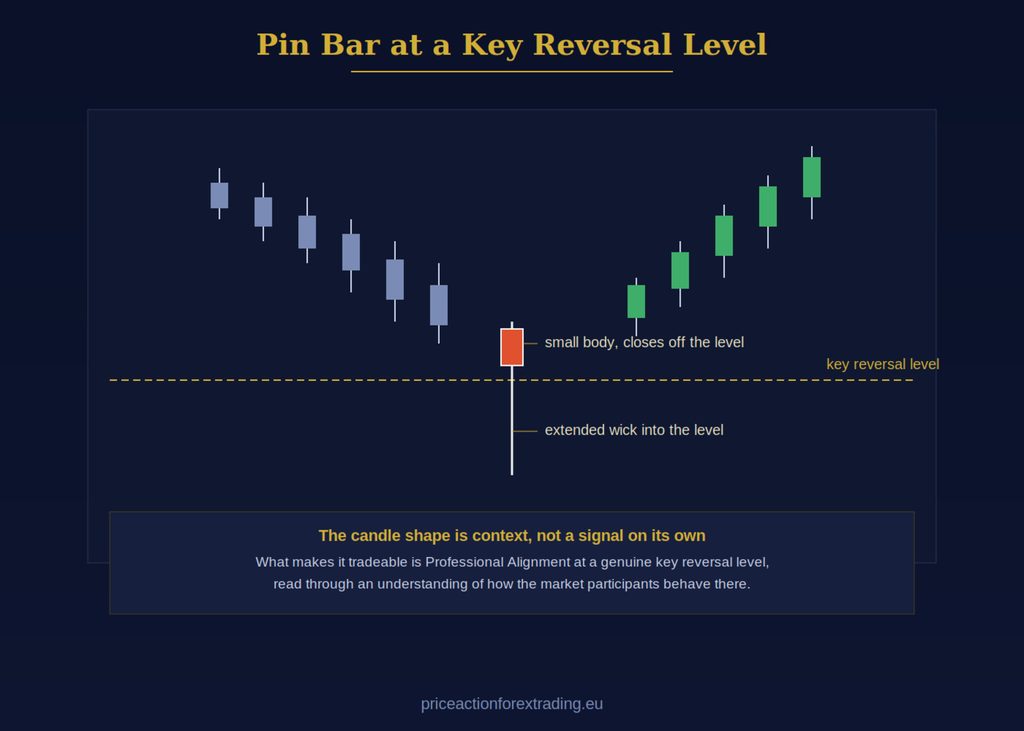
Strip away the retail language for a moment. What you are looking at with a pin bar is simply this: price extended into a level, then closed away from it within a single candle. That is the observable fact. Everything past that – why it happened, what it means, whether it is tradeable – depends entirely on context that the candle itself cannot give you.

I will not pretend the wick and the close are meaningless. They are a piece of information. But they are one data point, not a conclusion. On their own, they tell you what price did. They do not tell you why, and the why is what separates a candle worth acting on from a candle worth ignoring completely.

This is where genuine understanding of how the market actually moves comes in – specifically, understanding of the three groups of market participants whose behaviour shapes every key reversal level on your chart. This is not something I can lay out in a blog post. It is confidential material that I only go through in depth with people I train directly, because it took years to build and it is not available anywhere else, not on YouTube, not in forums, and not in most privately run courses either. What I can tell you is this: once you can read what those participants are actually doing at a level, a pin bar stops being a shape you are hoping means something, and starts being one confirming detail inside a much bigger picture.

Professional Alignment, Not a Standalone Trigger

In my own trading, I never act on a pin bar in isolation. What I am looking for is Professional Alignment – multiple things pointing the same direction at the same key reversal level before I consider a trade. The candle can be part of that picture. It is never the whole picture.

This is the same principle I apply across every setup I trade, whether that is a pullback into a level or a reversal. The specific mechanics of what I am aligning and how I read it are part of what I teach directly rather than publish, but the principle itself is simple to state – no single piece of evidence, however visually convincing, is enough on its own. A long wick at a level you have correctly identified as significant is worth paying attention to. A long wick anywhere else is just a long wick.

Where Volume Fits In

Volume gets dragged into pin bar strategies constantly, usually as a second filter stacked on top of the shape and location checklist. High volume on the pin bar, the theory goes, means the move is “stronger” or more likely to hold.

I use volume differently. It is never a standalone signal for me, and it never triggers a decision by itself. What it does is confirm a level I have already read as significant through other means. If I have identified a key reversal level and price prints a pin bar there, volume can add weight to that read. It cannot create significance out of nothing, and it cannot rescue a level that was never meaningful in the first place.

Traders who lean on volume as a primary signal are usually trying to compensate for not having a genuine read on the level itself. It is an understandable instinct. It does not solve the underlying problem.

Common Mistakes Traders Make With Pin Bars

A few patterns come up again and again when I look at how retail traders handle this setup:

Trading every pin bar they see. Once you know what to look for, pin bars are everywhere. Trading all of them, or even most of them, guarantees you are trading plenty of meaningless ones.

Drawing levels to fit the candle. It is tempting to look at a pin bar and then go find a reason it formed at “resistance.” This is backwards. The level has to be genuinely significant independent of the candle, not justified by it after the fact.

Ignoring what happens after. A pin bar is one candle. What price does in the following candles at the same level often tells you more than the pin bar itself did.

Assuming a bigger wick means a stronger signal. There is no fixed ratio that makes a pin bar “more valid.” A small, unremarkable-looking candle at a genuine key reversal level can matter far more than a dramatic-looking wick at a level that was never significant.

Treating it as beginner-friendly because it looks simple. The shape is easy to spot. Understanding when it actually matters is not, and that gap is exactly why so many traders lose money trading it.

Learning to Read Candles Properly

None of this means the pin bar is useless. It means it was never meant to be read alone. The candle is a piece of the puzzle, and understanding which pieces matter and why requires the kind of genuine professional understanding that most retail education simply does not teach, because most people teaching it do not have it themselves.

This is the gap my Forex Training Course is built to close, whether you are just starting out or you have been trading for years using checklists like the one above without knowing why they keep failing you. It is not an advanced-only course – it works the same whether this is your first month reading charts or your fifth year.

If you want a faster, more simplified route into how I actually read price, Learn to Trade in 5 Days walks through a full professional strategy from the ground up. It is a complete course in its own right, not a teaser for something else, and traders have gone on to be consistently profitable from it alone. Under the right training, this kind of understanding does not have to take years to build. I have seen it click for people in a single session, because the missing piece was never effort, it was access to genuine knowledge.

Final Thoughts

The pin bar is not a bad candle to pay attention to. It is a bad candle to trade in isolation. The wick and the body tell you what price did, not why it did it, and that missing piece is exactly what separates traders who read charts from traders who read the market.

If you take one thing from this article, let it be this: stop asking whether a candle looks like a pin bar, and start asking whether it formed at a level worth caring about in the first place. Everything else follows from that.

Thanks for reading and have a beautiful day!
Forex Momentum Price Action: How I Actually Read It (Not With Indicators)

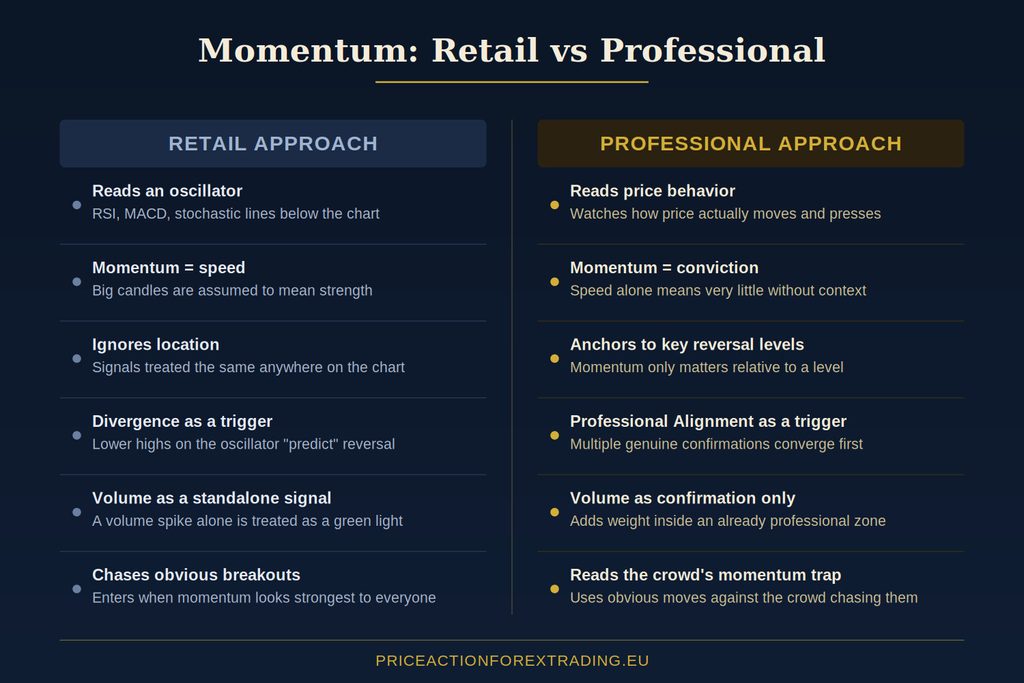
Momentum is one of those words that gets thrown around in forex trading until it stops meaning anything. Ask ten retail traders what momentum looks like on a chart and you will get ten different indicator setups: RSI turning up, MACD crossing a signal line, a stochastic climbing out of oversold. None of them are wrong exactly, but none of them are actually showing you momentum either. They are showing you a lagging mathematical summary of price that already happened.

I read momentum a completely different way, and it has nothing to do with an oscillator in a box below my chart. It comes from price action itself, from watching how price actually behaves as it approaches and moves through specific points on the chart. That distinction is not a small one. It is the difference between reacting to momentum after the fact and understanding it while it is forming.

What Most Traders Get Wrong About Momentum

The retail approach to momentum treats it as a standalone signal. Line goes up, momentum is bullish. Line goes down, momentum is bearish. Divergence forms, momentum is supposedly weakening and a reversal is coming. Traders build entire strategies around this logic, and then wonder why momentum indicators seem to give strong signals right before price does the opposite of what they expected.

The problem is not that momentum indicators are calculated incorrectly. The problem is that they are measuring the wrong thing. They measure the rate of change of price over a fixed lookback period. That is a mathematical description, not an explanation. It tells you what happened, not why it happened or whether it is likely to continue.

Real momentum in a currency pair is not a number. It is the visible behavior of price as it moves, and that behavior is a direct reflection of what is happening between the participants actually driving that movement. Once you start reading it that way, the indicator becomes almost irrelevant. You are watching the source instead of a delayed echo of it.

Momentum Is Not Speed

Here is a mistake I see constantly, even among traders who have moved past pure indicator dependence. They equate momentum with speed. Big candles, fast moves, price tearing through several price levels in a handful of bars. Surely that is strong momentum, right?

Sometimes. But speed alone tells you very little. I have seen fast, aggressive moves that ran out of conviction within minutes and reversed hard, and I have seen slow, grinding moves that carried for hours because the underlying pressure behind them never let up. Speed is the surface. What actually matters is whether the move is being sustained by genuine reason from the participants pushing it, or whether it is a short burst that has already exhausted itself.

This is exactly why I never gate a setup on how a trend has been structured, whether that is a clean sequence of higher highs and higher lows or some checklist of prior swing points. A fast, choppy move can carry real momentum behind it just as much as a textbook trending structure can. What tells me whether momentum is genuine is not the shape of the last few candles on a lookback chart. It is what I read in price behavior itself, built from genuine professional understanding of the three groups of participants active in that pair at that moment.

How I Read Momentum Through Price Behavior

I will be direct about this: the full mechanism of how I read the three participant groups is something I only teach inside my mentorship, not something I lay out in a blog article. That understanding took direct training under my own mentor, Robert Taylor, to develop, and it is the single biggest edge separating professional execution from retail guesswork. What I can tell you is what it looks like from the outside, so you understand the difference between what I am doing and what most public content teaches.

When I watch price move, I am not asking “is this candle bullish or bearish.” I am watching how price is being pushed, how eagerly it moves through certain price points, and how it behaves once it reaches an area that actually matters on the chart. Momentum that is genuine tends to move with a certain character, a willingness to keep pressing forward without hesitation building up along the way. Momentum that is not genuine often shows itself through subtle changes in that character well before an indicator would ever pick it up.

This is not something you can shortcut with a formula, and I am not going to pretend otherwise or invent a mechanism to make it sound simpler than it is. It is a skill built through direct, professional training. But it is also a skill that develops far faster than most traders assume once they are learning it correctly. I did not need years of screen time to get there. Under the right guidance, this kind of professional reading can click in a matter of sessions, not seasons.

Where Momentum Actually Matters: Key Reversal Levels

Momentum on its own, floating in the middle of a chart with nothing else around it, tells me very little. What makes momentum actually useful is where it is happening. I care about momentum specifically as price approaches or interacts with a key reversal level, one of the points on the chart where I have genuine reason to expect participant behavior to shift.

This is where a lot of traders go wrong with continuation setups too. They see a strong move, wait for a shallow pullback, and jump in purely because the trend “looks strong,” without any regard for where price actually is relative to a level that matters. I cover this same mistake in more detail in my piece on continuation patterns, because the shape of the pattern is never the point. The location is.

Strong momentum arriving at a key reversal level tells a very different story than strong momentum arriving in the middle of nowhere. The first is something I can act on with confidence once everything else lines up. The second is often just noise waiting to happen, a move that looks impressive on the screen but has nothing meaningful backing it at that specific point in price.

Professional Alignment: Momentum Is Only One Piece

I want to be clear that momentum by itself is never enough to justify a trade. I do not take entries because momentum looks strong. I take entries when momentum is one part of what I call Professional Alignment, the convergence of multiple pieces of genuine professional confirmation pointing toward the same conclusion at the same location.

Momentum can tell me that a move has real conviction behind it. But without it converging with everything else I am reading, from the behavior at the key reversal level itself to the wider context of what the three participant groups are doing, momentum alone would just have me chasing moves that fizzle out. Professional Alignment is what keeps momentum from becoming a trap rather than a tool.

This is also why volume never acts as a standalone trigger in how I trade. Volume analysis has a role, but only as confirmation within an already professional zone, adding weight to a read I have already built from price behavior and Professional Alignment. It is never the reason I click the button on its own.

Why Indicator Divergence Isn’t What You Think

Divergence deserves its own mention because it is probably the single most misunderstood momentum concept in retail trading education. Price makes a new high, the oscillator makes a lower high, and traders are taught this means momentum is fading and a reversal is imminent. Sometimes price does reverse after a divergence signal. Often it does not, and the “weakening momentum” the indicator claimed to spot simply continues on for another leg.

The reason divergence is unreliable on its own is the same reason indicators in general are unreliable on their own: the calculation has no idea where price actually is relative to a key reversal level, and it has no ability to read what the participants behind that move are actually doing. Divergence is a pattern in a derived number, not an observation of behavior. Two charts can show identical divergence readings and mean completely different things depending on the location and the professional context around them.

I am not telling you to ignore divergence out of stubbornness. I am telling you that if you want to know whether momentum is genuinely fading, watching price behavior directly at a key reversal level will tell you far more, and far sooner, than waiting for an oscillator to catch up and draw two lines that may or may not point the right way.

Momentum Traps: When It Looks Real But Isn’t

There is a specific kind of momentum trap that catches a huge number of retail traders, and it usually happens around obvious chart levels. Price accelerates toward a level everyone can see, momentum indicators light up green or red, and traders pile in expecting a breakout to run. Then price stalls and reverses hard.

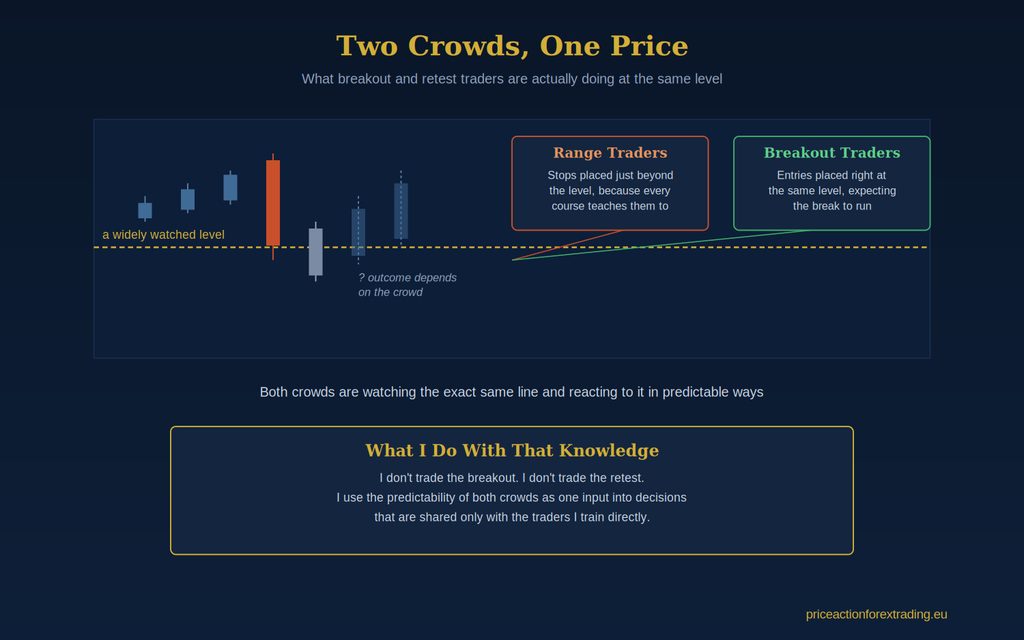
I will not pretend to explain the exact mechanism behind why this happens so consistently, because that understanding is something I keep for my mentees rather than speculate about publicly. What I will say is that this pattern is closely tied to why I do not treat breakout momentum around obvious levels the way most public education teaches it. If you want the fuller picture on that specific trap, I wrote about it directly in my article on why I don’t trade breakout and retest setups the way the crowd does. Momentum that appears right at these obvious points is very often crowd behavior I read and use to my advantage, not a signal I follow at face value.

The lesson here is simple even if the mechanism behind it is not something I lay out publicly: momentum needs context and location before it means anything at all. Momentum arriving exactly where everyone expects it, at a level with no genuine professional read behind it, is one of the most reliable ways to get trapped in this market.

Building This Skill the Right Way

I know how this reads if you are coming from years of trying to force indicators to give you clean momentum signals. It can sound like I am describing something vague or unlearnable. I promise you it is neither. It is a skill, and skills are trainable when the training itself comes from someone who actually understands the mechanism rather than someone repeating retail theory they picked up from a forum.

This is exactly what I built my Forex Training Course around, and it is suitable whether you are picking up a chart for the first time or you have been trading for years and have simply never had anyone show you how to read momentum this way. If you want a faster, focused entry point into this kind of professional reading using one complete strategy, my Learn to Trade in 5 Days course teaches everything you need to trade that strategy profitably on its own, momentum reading included, not as a taste of something bigger but as a genuinely complete method.

Final Thoughts

Momentum in forex is real, and it matters enormously to how I trade every single day. But it is not an indicator reading, and it is not simply a matter of speed. It is a reflection of genuine reason among the participants actually moving the market, readable through price behavior once you know what you are actually looking at and where on the chart it counts.

Stop asking your indicators whether momentum is strong. Start asking what price is actually telling you at the levels that matter, and start building the kind of professional understanding that lets you answer that question with confidence rather than a guess dressed up as a signal.

Thanks for reading and have a beautiful day!
Forex Continuation Patterns: Why the Shapes You Were Taught to Spot Are the Least Important Part

Every retail trader learns the same list at some point: flags, pennants, triangles, wedges. String enough candles together and eventually one of these shapes appears on the chart, and you’re told that when it does, the trend is “pausing before continuing.” Draw two lines around the pause, wait for a breakout of the shape, and you’ve got yourself a continuation trade.

I spent years believing this too, before I received direct training from my mentor, Robert Taylor, that reframed almost everything I thought I knew about how continuation actually works in this market. What I want to walk you through here isn’t a rejection of the concept of continuation – trends absolutely do continue, constantly – but a rejection of the idea that a visual shape is what causes it, or that spotting the shape is what should trigger your entry.

The Problem With Naming Shapes After They’ve Already Happened

Here’s something that should bother you more than it probably does: you can only label a flag, a pennant, or a triangle once it has finished forming. The lines that define the pattern aren’t visible until price has already drawn most of the pattern out. By the time you can confidently say “that’s a bull flag,” a meaningful portion of the move you wanted to catch has already happened without you in it.

This is the quiet flaw in almost all continuation pattern education. It teaches you to recognize completed structures, not to anticipate developing ones. And market structure is genuinely difficult to identify in real time – it only looks obvious in hindsight, on a chart that has already closed. A continuation pattern taught this way is a description of the past dressed up as a signal for the future.

I’m not saying flags and triangles don’t exist as visual phenomena. They do, and you’ll see them on every chart you look at. What I’m saying is that the shape itself carries none of the information that actually matters. The shape is a symptom. The cause is something else entirely.

What Actually Drives a Trend to Continue

Price in this market isn’t the result of a simple negotiation happening between two sides. It’s driven by three distinct groups of market participants, each with their own behaviour, their own timing, and their own reasons for being in the market at any given moment. Understanding how these three groups interact – who is active, who is stepping back, who is about to become dominant – is the actual mechanism behind why a trend keeps going instead of reversing.

This understanding isn’t something you can pick up by staring at chart shapes on YouTube or in a forum thread. It’s the part of trading that most public education, and frankly most paid courses, never actually teach, because it isn’t something the person teaching genuinely understands themselves. It’s the core of what I try to pass on inside my Forex Training Course, and it’s the single biggest difference between a trader who is guessing at shapes and one who is reading the market.

Once you can genuinely read what these three groups are doing, a continuation trade stops being about finding a pattern and starts being about recognizing that price is likely to keep moving in a given direction – and then waiting for the right place to act on that read.

Where the Pullback Actually Matters: Key Reversal Levels

This is where most of the retail approach to continuation falls apart in practice. Retail traders are taught that a pullback only “counts” once the trend has printed a certain sequence of higher highs and higher lows, or once the flag or channel has drawn itself out cleanly. That’s a checklist, not an understanding.

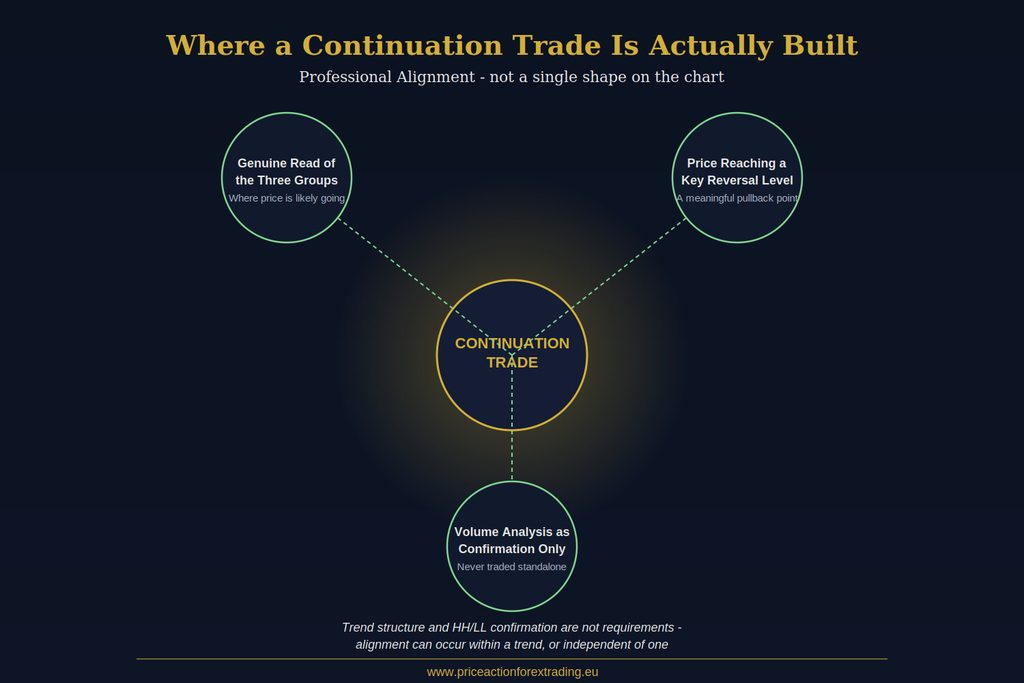
In my approach, what actually qualifies a pullback to be traded has nothing to do with whether a tidy HH/LL sequence exists beforehand. It comes down to two things converging: a genuine read of where price is going, built from watching the three groups of participants, and that pullback reaching a key reversal level. When those two things align, the trend structure around it becomes almost irrelevant. This can happen inside an obvious, well-established trend. It can just as easily happen when there’s no clean trend structure at all. I’ve written in more detail about how I treat these levels in my article on support and resistance zones, and the same logic applies directly here – a key reversal level doesn’t need a textbook trend sitting behind it to be valid.

I’m not going to speculate here on exactly why a key reversal level holds where it does. That mechanism is something I keep for mentees, because it’s tied directly into how you read the three groups, and it isn’t something you can shortcut with a generic explanation. What I can tell you is that it isn’t about participants “losing conviction” or a level “getting weaker.” Those are retail rationalizations for something they don’t actually understand, applied after the fact to make a chart story sound coherent.

Professional Alignment: Why One Signal Is Never Enough

A shape on a chart is a single data point. Professional Alignment is what happens when several independent factors point the same direction at the same time – the read on the three participant groups, the location relative to a key reversal level, and how price is actually behaving as it approaches that level. None of these factors alone is a trade. Together, they’re what separates a professional continuation entry from a retail guess dressed up as a pattern.

This is also why I don’t treat volume in isolation. Volume analysis has a place, but only as confirmation inside a zone where Professional Alignment is already present – never as a standalone trigger. If volume is telling you something but nothing else lines up, you don’t have a trade. You have one data point pretending to be a decision.

Entry Timing: Why Waiting for the Breakout Costs You the Trade

Retail continuation strategies almost universally wait for price to close beyond the pattern’s boundary before entering. That candle close is treated as “confirmation.” The problem is that by the time that candle has closed, the professionals who actually moved price to that point have already been positioned for some time.

I enter at the tip of the key reversal level itself, before the candle closes – not after a shape confirms, and not after a boundary breaks. If the resulting candle happens to look like a pin bar or some other recognizable formation afterward, that’s coincidental. It’s not the method, and it’s not what I’m watching for. The method is the read, the level, and the timing – not the shape the candle leaves behind once it’s done.

This is one of the hardest habits for traders coming from a retail background to unlearn, because it feels uncomfortable to act before there’s visual “proof.” But visual proof, by definition, only exists after the opportunity has already been taken by someone else.

A Note on Breakouts and Retests Within Continuation Setups

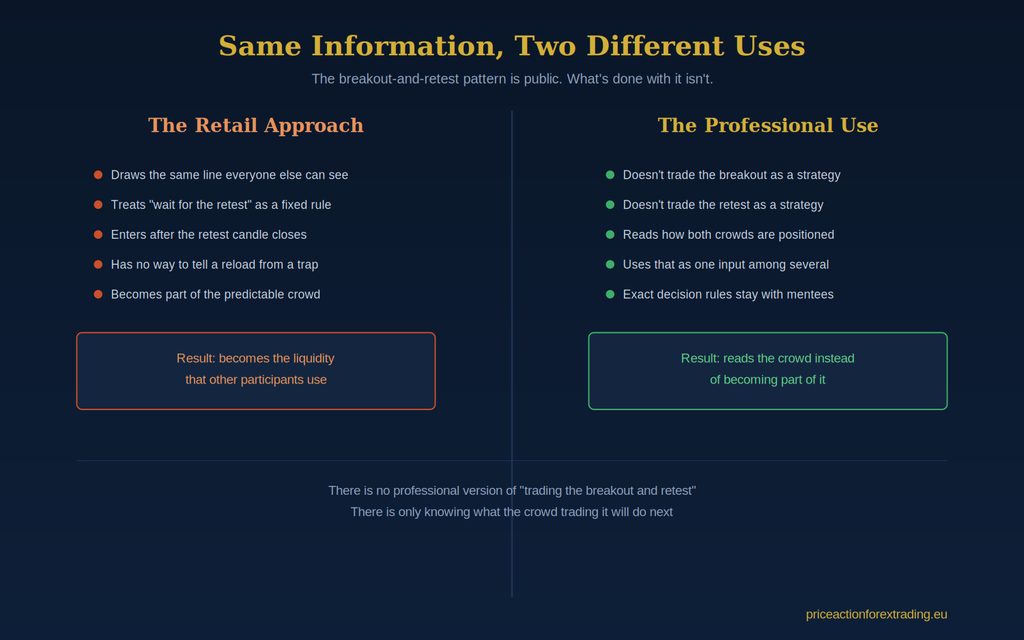
You’ll often see continuation patterns marketed alongside breakout-and-retest entries – wait for the pattern to break, wait for price to come back and retest the broken boundary, then enter. I’ve written a full breakdown of why I don’t trade breakout and retest as a standalone method, and the same reasoning applies to continuation setups built around it. I read the crowd behaviour around these retests and use it to my advantage, but the specific decision-making behind how I act on it isn’t something I lay out publicly. It’s reserved for those I train directly.

Common Mistakes I See With Continuation Patterns

The most common mistake is treating pattern recognition as the entire strategy rather than one small, late-arriving piece of information. A close second is assuming continuation setups only work during certain sessions – they don’t. A professional read works at any time of day or night; the only thing that changes with the session is the liquidity behind the move, not whether the setup itself is valid.

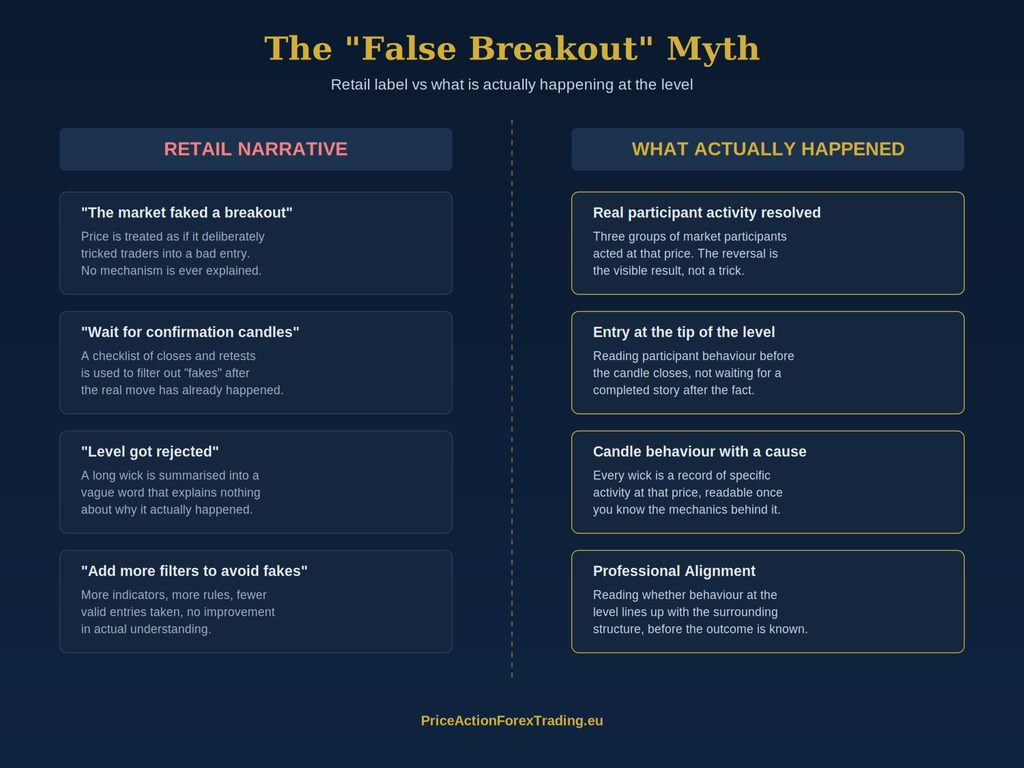
Another mistake worth naming: traders assume that if a “continuation pattern” fails to continue, something abnormal happened – a “false breakout,” in the language most people reach for. I’ve explained elsewhere why the false breakout doesn’t actually exist as a distinct phenomenon – it’s a label retail traders apply when their read on the three groups was wrong from the start, not evidence that the market did something unusual.

What This Looks Like on a Real Chart

Picture a pair that has been climbing for several hours. A retail trader watching this move will start drawing converging trendlines the moment price starts to slow down, hunting for the pennant shape to complete so they can mark a breakout level above it. They’ll sit and wait, sometimes for dozens of candles, for that shape to resolve.

I’m not looking at the slowdown as a shape in progress. I’m looking at whether the pause is happening into a key reversal level I already had marked out, and whether what I understand about the three groups tells me buying pressure is likely to resume from there. If those two things are present, I don’t need the pennant to finish drawing itself – I already have what I need to act, and I’ll be positioned before the shape retail traders are waiting for has even become visible. By the time their pennant “confirms” with a breakout candle, I’m already deep into the move.

This is also why two traders can look at the exact same chart, at the exact same moment, and come away with completely different conclusions. One is pattern-matching a shape from a textbook. The other is reading behaviour. They are not doing the same activity, even though they’re staring at the same candles.

Continuation Doesn’t Require a Perfect Trend

One more point worth stressing, because it trips up a lot of traders coming from a retail background: continuation setups aren’t reserved for markets in a clean, obvious trend. I’ve written before about how higher highs and lower lows are frequently misread by traders looking for tidy confirmation before they’ll act. A market can be choppy, directionless-looking, or halfway through building structure, and a genuine continuation opportunity can still be sitting right in front of you if the read on the three groups and the location at a key reversal level are both present. Waiting for a textbook-perfect trend before you’ll consider a continuation trade means you’ll miss a large share of the opportunities that are actually there.

Why This Isn’t Something You Pick Up Slowly Over Years

There’s a persistent idea in trading education that this kind of skill takes years to develop, that you should be patient with plateaus and treat losses as part of a long, gradual arc. I don’t subscribe to that framing, and I don’t think it’s honest. Under the right mentor, with direct, hands-on training, corrections in how you read the market can happen fast – sometimes within a single session. The years-long timeline exists because most people are trying to reverse-engineer this understanding from public sources, forums, and pattern-recognition courses that were never going to get them there in the first place.

If you want to shortcut past the pattern-naming stage entirely and start learning to read what actually drives continuation, my Learn to Trade in 5 Days course teaches this from a professional market perspective using one strategy in depth – not as a preview of something bigger, but as a complete, standalone approach traders can be profitable with on its own.

Bringing It Together

A flag, a pennant, or a triangle is not a strategy. It’s a shape that appears, after the fact, on charts where a trend happened to continue. The actual reasons a trend continues have nothing to do with the geometry you draw around old candles – they come down to genuinely understanding the three groups of participants moving price, recognizing when a pullback reaches a key reversal level, and requiring Professional Alignment before you ever consider pulling the trigger.

Retail education will keep teaching the shapes because they’re easy to draw and easy to sell in a course preview. Reading the market the way I do took real, direct training to develop – and it’s the only version of “continuation pattern trading” I’d ever put my own money behind.

Thanks for reading and have a beautiful day!
Forex Reversal Strategy Price Action: How I Actually Trade Reversals

Every trader eventually goes looking for a reversal strategy. It usually happens after a string of losses buying breakouts or chasing trends that had already run their course. Someone tells them “just learn to spot reversals” and they go off searching for the perfect candlestick pattern, the perfect indicator combination, the perfect confirmation signal that tells them “this is the top” or “this is the bottom.”

I went through that exact phase myself, years before I understood what price is actually doing. And I can tell you plainly: almost everything taught publicly about reversal trading in forex is built on the wrong foundation. It’s not that the patterns don’t exist. It’s that traders are taught to react to shapes on a chart instead of reading who is actually behind the move.

In this article I want to walk you through how I actually approach reversals – not as a checklist of candle shapes, but as a read of price behaviour at the right location, confirmed the right way, at the right time.

Why Most Retail Reversal Strategies Don’t Work

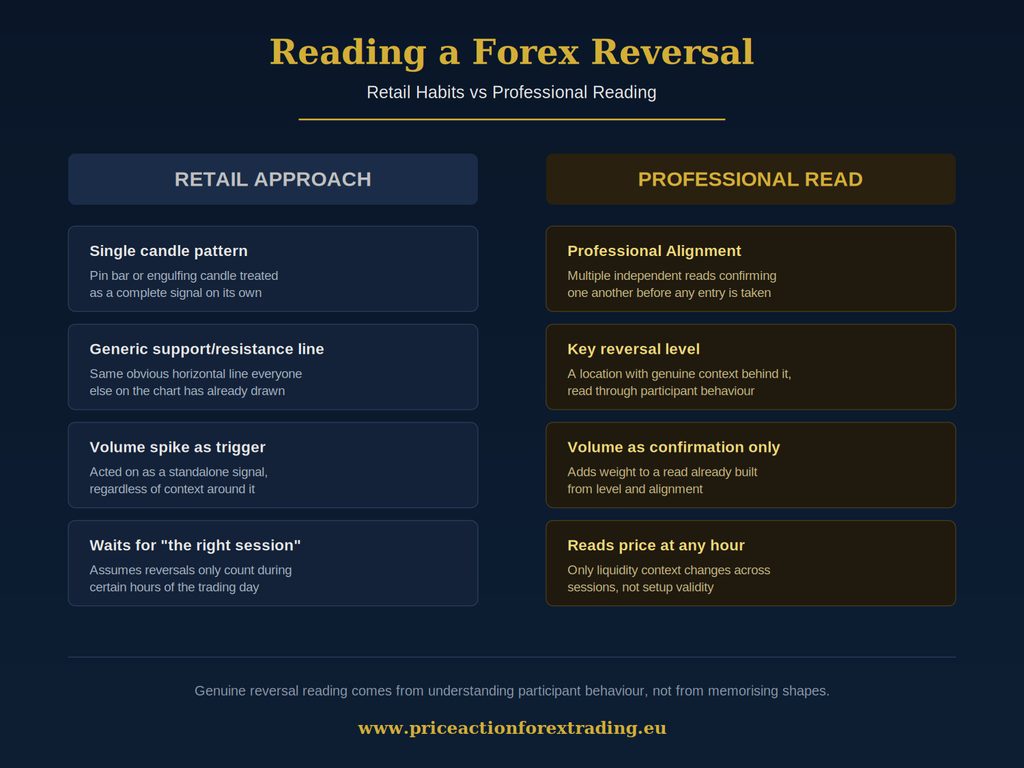
Open any forum or YouTube video about reversal trading and you’ll find the same recycled ideas: pin bars, engulfing candles, double tops, head and shoulders, RSI divergence. None of these are useless as raw observations. The problem is what traders are told to do with them.

Retail education treats these shapes as signals in isolation. See a pin bar at a swing high, sell it. See bullish divergence on RSI, buy it. There’s no depth to the read – just pattern matching applied mechanically, regardless of what’s actually happening underneath the price action.

That’s why the same “reversal pattern” works beautifully in one instance and fails completely in the next. The shape on the chart was never the actual signal. It was a symptom of something happening beneath the surface, and retail education never teaches you what that something is.

I wrote in more detail about this gap between what price action actually communicates and what most people are taught to look for in what price action really means in forex trading, and it’s worth reading alongside this piece if you haven’t already.

What A Reversal Actually Is

A reversal isn’t a candle shape. It’s a shift in who is in control of price at a specific location on the chart. Price doesn’t move because of “buyers versus sellers” in some abstract tug of war – that framing is too simple to be useful. The forex market is made up of distinct groups of participants, each with different reasons for being in the market, different time horizons, and different levels of influence over where price actually goes next.

Genuinely understanding how those groups behave, and being able to read their footprints on a chart, is the actual skill behind spotting a reversal early and with confidence. This is not something you pick up from a YouTube comment section or a free PDF. It’s the kind of understanding that gets transferred directly, from someone who already has it, to someone who doesn’t – which is exactly why mentorship matters so much more than most traders realise. I explain this at length in how to learn forex trading without wasting years on the wrong things.

A reversal, properly read, is simply price reaching a location where the balance of control changes hands. Everything else – the specific candle that finally confirms it, the exact tick where momentum shifts – is downstream of that.

Key Reversal Levels: Where I Actually Look

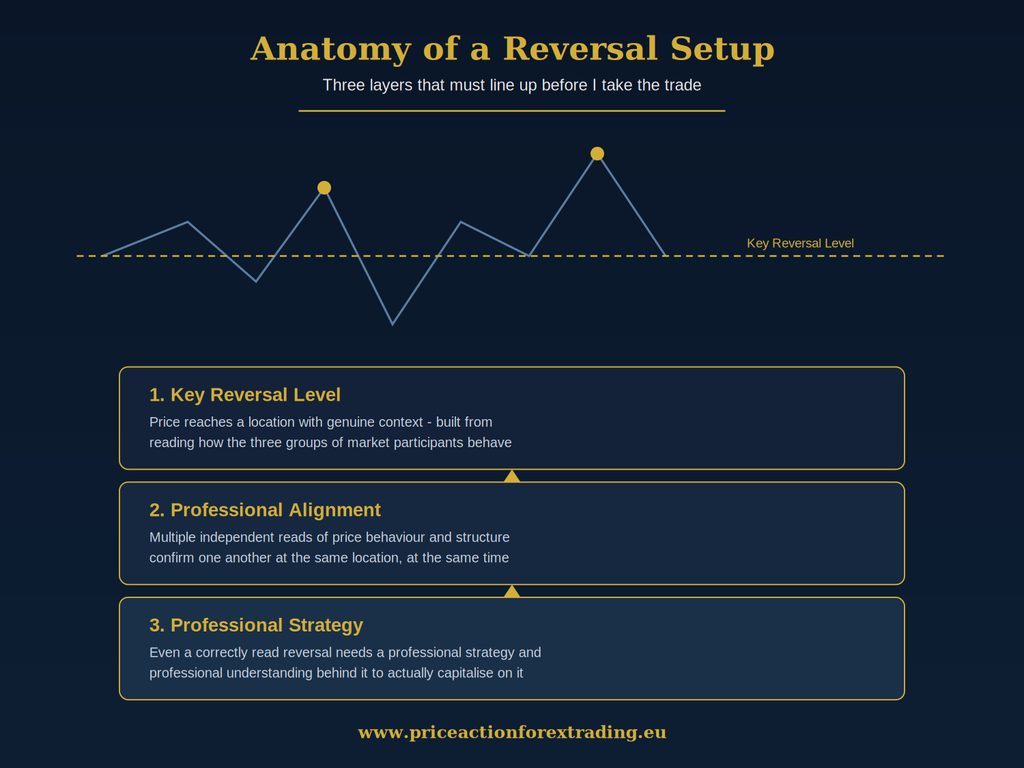
Every reversal I trade happens at what I call a key reversal level. These are not the same thing as the generic support and resistance lines you’ll find drawn on every retail chart. A key reversal level is a location where I have genuine reason – built from experience reading how the three groups of market participants behave – to expect that control of price is likely to change hands.

I’ve written a full breakdown of why the popular idea of drawing horizontal lines at old highs and lows falls apart in practice, in support and resistance zones in forex: what retail actually does there and how I trade against it. The short version: most traders are drawing the same obvious lines, reacting to price in the same predictable way at those lines, and that predictability is precisely what creates opportunity for someone reading the chart properly.

A key reversal level isn’t magic. It’s a location with history and context behind it – the kind of context that becomes obvious once you know what you’re looking for, and stays completely invisible if you don’t. This is one of the areas where I go into real depth inside the Forex Training Course, because it’s genuinely difficult to convey the nuance of reading these levels through text alone. It’s something best absorbed through direct examples and direct feedback on your own charts.

Professional Alignment: Why One Signal Is Never Enough

Here’s where most retail reversal strategies collapse completely: they rely on one single trigger. One candle. One indicator cross. One touch of a line. That’s simply not enough information to act on, and it’s why so many “reversal setups” fail almost immediately after entry.

What I look for instead is Professional Alignment – multiple independent reads of the chart all pointing to the same conclusion, at the same location, at the same time. This might include how price approached the key reversal level, what the surrounding structure looks like, how price is behaving on a shorter timeframe as it reaches the level, and what the broader context of the move suggests about the three groups of market participants currently active.

When these different reads line up, I have a genuinely high-quality reversal setup. When they don’t – when I only have one piece of the picture – I stay out, no matter how tempting the chart looks in isolation. This is the actual discipline behind reversal trading, and it has nothing to do with rigid stop-loss percentages or generic risk rules. It’s about knowing the difference between a setup you actually understand and one you’re just hoping works out.

The Role of Volume At A Reversal

Volume gets thrown around a lot in reversal trading discussions, usually as its own standalone signal – “volume spiked, so the reversal is confirmed.” I don’t use it that way, and I’d caution you against it too.

Volume, on its own, tells you very little. A volume spike can happen for dozens of reasons that have nothing to do with a genuine reversal. What volume is actually useful for is confirming something you’ve already identified through Professional Alignment at a key reversal level. It’s the final layer of confidence, not the trigger itself. If you’ve correctly read that a key reversal level is in play and the alignment is there, a supporting shift in volume behaviour adds weight to the read. Used as a standalone signal, it will mislead you just as often as it confirms.

How Reversals Relate To Pullbacks and Trend

A lot of traders get confused about where reversal trading ends and pullback trading begins, and honestly the confusion is understandable, because both concepts revolve around price reacting at a meaningful location.

The difference comes down to what happens after the reaction. A pullback is a temporary pause within an existing move, where price is still expected to continue in its original direction after reaching a key reversal level. A reversal is a genuine change in that expected direction. I’ve written separately about how I judge pullback validity in forex pullback strategy: why most pullback entries fail and what actually works, and the core principle carries over here too: what matters isn’t whether price satisfies some checklist of higher highs and higher lows beforehand. What matters is whether you genuinely understand where price is going, based on a real read of the three groups of participants, combined with price reaching the right level.

The same applies to reversals. A reversal doesn’t need a textbook trend structure behind it to be valid, and it doesn’t need to wait for some confirmation pattern taught in a retail course. It needs a key reversal level, Professional Alignment, and – when available – supporting volume behaviour. That combination can appear inside a strong trend, at the end of a long move, or completely independent of any clean trend structure at all. If you want to understand trend structure itself in more depth first, I cover it fully in how to identify trend in forex.

Common Mistakes Traders Make Trading Reversals

I see the same handful of mistakes repeated constantly by traders trying to trade reversals on their own, without proper guidance:

Trading every touch of a line as a reversal signal. Not every approach to a level is a reversal. Most of them aren’t. This is exactly why a single candle shape can never be enough on its own.

Ignoring context entirely. Trading a reversal pattern on a random timeframe, at a random price, with no relationship to a genuine key reversal level, is just gambling with extra steps.

Treating volume as a standalone trigger. As covered above, this leads to false confidence at exactly the wrong moments.

Assuming reversals only happen at certain times of day. A properly read reversal setup can appear during any session – London, New York, Tokyo, the overlaps, even the quieter hours. What changes across sessions is liquidity, not whether a genuine reversal can occur. Traders who wait around for “the right session” are missing setups that don’t care what the clock says.

Expecting the market to explain itself in obvious ways. Every detail on the chart matters to someone who can actually read it. Dismissing large sections of price movement as irrelevant “noise” is a habit that keeps traders permanently blind to information that’s sitting right in front of them.

Why This Understanding Doesn’t Come From Public Sources

I want to be direct about something here, because I think it matters more than most trading content admits: you will not find genuine reversal-reading skill on YouTube, on forums, or inside most privately sold courses either. What gets taught publicly is almost always the same recycled set of candle patterns and indicator rules, repackaged with new branding.

Genuine professional understanding of how the three groups of market participants behave, and how that translates into readable reversal setups at key reversal levels, is something that gets passed down directly – from someone who has it, to someone willing to learn it properly. I was fortunate enough to receive that training directly from my own mentor, Robert Taylor, and it changed how quickly I was able to trade with real confidence. You can read more about him and what he meant to my own development as a trader on my tribute page to Robert Taylor.

Under the right mentor, this kind of correction to your reading of the market doesn’t take years. I’ve seen it happen inside a single session of direct training. That’s the entire premise behind the Learn to Trade in 5 Days course – it’s a complete, standalone way of acquiring a real professional understanding of one strategy, reversal-based setups included, without needing to spend years accumulating fragments of information from unreliable sources.

Putting It Together

If you take one thing away from this article, let it be this: a forex reversal strategy built on price action isn’t a list of candle patterns to memorise. It’s the ability to read where a genuine change of control is likely to happen, confirm that read from multiple independent angles, and understand that confirmation isn’t optional – it’s the entire foundation of a trade you can actually trust.

That skill isn’t something you can shortcut with an indicator, and it’s not something that only reveals itself after years of trial and error either. It comes from proper training, applied to real charts, under someone who already knows how to read them. I’d genuinely encourage you to explore what that kind of training actually looks like inside the Forex Training Course if reversal trading is something you want to take seriously.

Thanks for reading and have a beautiful day!
Forex Range Trading Strategy: How I Trade the Market When It Isn’t Trending

Most traders treat range trading like a consolation prize. If the market isn’t trending, the thinking goes, you’re stuck buying the bottom and selling the top of a boring box until something more exciting happens. That framing is exactly why most range trades lose money. A range isn’t a boring pause between the “real” moves – it’s one of the clearest windows you’ll ever get into how the three groups of market participants are actually behaving, and reading it correctly is a skill in its own right.

I trade ranges often, and I trade them very differently from the way they’re taught on YouTube or in most forums. In this article I’ll walk through what a forex range actually represents, why the retail approach to it fails so consistently, and how I structure a range trade using the same principles I use everywhere else in my trading.

What a Forex Range Actually Is

A range forms when price oscillates between a ceiling and a floor without making sustained progress in either direction. Retail material describes this as “support and resistance” holding the price in place, as if there were two static lines and the job is simply to buy near one and sell near the other. I’ve written before about why that entire framework is incomplete, and a range is where the gap between the retail version and the professional version shows up most clearly.

What’s really happening during a range isn’t something I can lay out in a public article – the actual reason a range holds where it holds is part of what I train mentees on directly. What I can say is that a range is not empty or directionless just because price isn’t making sustained progress. There’s constant activity inside that box, and every candle inside it is telling part of the story to someone who knows how to read it. Retail material tends to fill that gap with guesses about what “must” be happening, and most of those guesses are wrong.

This is also why I don’t treat a range as a special category that needs its own separate rulebook. It’s still built from key reversal levels, the same proprietary concept I use to read every other kind of price behaviour, whether that’s a pullback, a breakout, or a full trend. A range simply means price is currently oscillating between two key reversal levels instead of pushing through them.

Why Most Retail Range Trading Fails

The standard retail approach is mechanical: mark the top and bottom of the range, buy near the bottom, sell near the top, and repeat until the range breaks. It sounds simple enough to work, and occasionally it does – which is exactly the problem, because it works often enough to convince traders it’s a real edge before it eventually stops working and gives back everything they made.

The reason it fails is that the retail trader is reacting to price location alone. They see price near the bottom of a visible box and assume it will bounce, with no genuine read on what’s actually happening at that zone – just an assumption based on where the price happens to be sitting. A range doesn’t hold forever. At some point the same zone that produced three clean bounces won’t produce a fourth, and the mechanical trader has no way of knowing in advance which visit to the edge is the one that breaks. They find out with their stop loss.

I see this constantly in how retail traders talk about ranges: bounce off the bottom, bounce off the top, treat every touch of the level the same way. But not every touch of the same price level is created equal. What matters is what’s happening at that level each time price returns to it, not simply that price has arrived there again.

How I Read a Range

My approach starts from the same place every other setup starts from: understanding where price is actually going to based on the behaviour of the three groups of market participants, not just the boundaries of the box on the chart. A range gets interesting to me the moment I have a genuine read on what’s building at one side of it, even while price is still technically inside the box.

That’s the distinction I want to be clear about. A mechanical range trader waits for price to arrive at the edge and then acts. I’m reading what’s building toward that edge before price ever gets there, which tells me whether the eventual touch is likely to hold or fail. This is the same professional thinking I apply to trend structure and to every other part of my process – the specifics of what I’m reading in a given range are part of what I train mentees on directly, because writing out every detail publicly would hand away the exact edge that makes this worth trading.

What I can say is that volume analysis plays a confirming role here, never a standalone one. I don’t look at volume in isolation and decide a range edge will hold or break based on that number alone. Volume only means something to me once price is already at a key reversal level – it either supports what the level is already telling me or it doesn’t. Used any other way, volume becomes just another lagging indicator dressed up to look more sophisticated than it is.

The Structure of a Professional Range Trade

When I do take a trade inside a range, it’s built on Professional Alignment – multiple pieces of the picture agreeing with each other before I commit. That includes the key reversal level itself, the way price is behaving as it approaches that level, and the confirming read from volume analysis once price arrives. None of these on their own is enough. It’s the alignment between them that turns a range edge from a guess into a trade I’m willing to take with real size.

This is also where professional thinking replaces mechanical discipline. Retail material tends to frame range trading execution around position sizing rules and “stick to your plan” platitudes, as if the hard part is emotional control once the trade is already identified. In my experience the hard part happens earlier – it’s whether you correctly read the level in the first place. Get that right, and the execution stage is simply applying what you already know with the confidence that comes from actually understanding what’s in front of you.

I’d also point out that a range trade isn’t restricted to a particular session. I don’t treat London differently from New York or Tokyo when I’m reading a range – the same principles apply regardless of when the range happens to be forming. The clock isn’t part of what determines whether a level holds.

When a Range Is About to Break

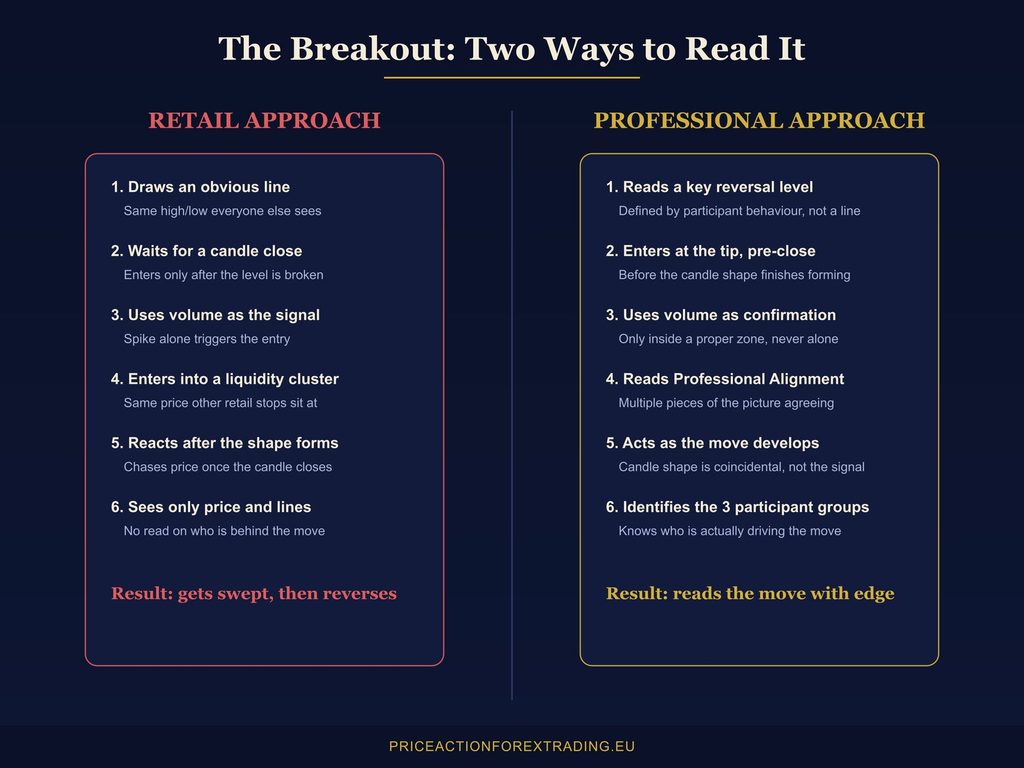
Every range eventually ends, and the way it ends tells you almost as much as the range itself. I’ve written in detail about how I read a breakout, and what actually causes a range to break is, again, part of what stays confidential to mentees rather than something I can lay out publicly.

The retail crowd tends to treat every approach to the edge of a range the same way, right up until the one that breaks – and then they’re caught leaning the wrong way, either still trying to fade a level that’s no longer holding or chasing a move that’s already left them behind. Because I already have a genuine read building before the break happens, rather than reacting to the break itself, I’m not relying on the breakout candle to tell me something has changed. By the time most traders notice the range has broken, I’ve usually already had a read on it building for several candles.

This is also why I don’t separate “range trading” and “breakout trading” into two unrelated skill sets that need to be learned independently. They’re two views of the exact same underlying behaviour – what the three groups of participants are doing at a key reversal level – just observed at different points in time.

Common Mistakes Traders Make With Range Trading

A few patterns come up repeatedly with traders who struggle with ranges. The first is treating the range as a fixed, unchanging box the moment it’s drawn, rather than reassessing the boundaries as new information comes in. A range is a live read, not a static rectangle you mark once and trade against for the next two weeks.

The second is trading every single touch of the range boundary with equal conviction. Some approaches to a key reversal level are backed by genuine strength behind them, and some aren’t. Treating them identically is how a trader ends up with a string of small wins followed by one loss that erases all of them.

The third is ignoring how a range sits within the bigger picture. A range that forms after a strong prior move is being read by a different group of participants than a range that forms after a long period of indecision, even if the two boxes look identical on a chart. Context matters, and it’s part of what separates a read built on real understanding from one built on pattern matching a shape.

The fourth mistake, and one of the most common, is assuming a range needs to display a particular structure before it can be traded at all. I regularly see traders wait for a certain number of touches on each side, or insist a range must be perfectly flat and symmetrical before they’ll consider it valid. That’s another checklist dressed up as analysis. What actually qualifies a range edge to be traded is genuine understanding of what the three groups of participants are doing at that key reversal level, not how many times price has previously visited it or how tidy the box looks on the chart. A range can be tradable on its very first approach to a level if the read behind that level is genuine, and it can remain untradable after a dozen touches if the read isn’t there.

How a Range Compares to a Trending Market

It’s worth being clear that a range isn’t a separate discipline from trend trading. The tools I use don’t change between the two – only the outcome of what I’m reading changes.

This is part of why I don’t think of “range trading” as a niche skill that sits apart from everything else I do. A trader who genuinely understands how to read a key reversal level can apply that understanding whether price is trending, ranging, or transitioning between the two. A trader who only knows mechanical rules for one specific market condition will always be caught off guard the moment conditions shift, because their approach was never built on understanding in the first place – it was built on a pattern that happened to work until it didn’t.

Where This Fits Into Learning to Trade Properly

None of this comes from public sources, and that’s not a knock on the people producing that content – it’s simply that this level of market reading isn’t something that gets taught for free, or in most paid courses either. It’s the kind of understanding that gets built under direct mentorship, and it can be built a lot faster than most traders assume. I don’t believe you need years of screen time to get here. I believe you need the right training.

If you want to build this understanding from the ground up, my Forex Training Course covers exactly this kind of market reading, and it’s built for traders at any stage, not just beginners or only advanced traders. If you’d rather get a complete, standalone strategy you can start applying immediately, my Learn to Trade in 5 Days programme teaches professional market understanding through one strategy in full, and traders have gone on to be profitable from that course alone.

Ranges aren’t the boring part of the market. They’re one of the clearest places to see who’s actually in control, if you know what you’re looking at.

Thanks for reading and have a beautiful day!
Forex Pullback Strategy: Why Most Pullback Entries Fail and What Actually Works

Every trader has heard the same advice: “wait for the pullback.” Let price break out, let it retrace, then jump in at a better price. It sounds sensible. It is taught in almost every free course and repeated in almost every forum thread. And it is exactly why so many retail traders keep entering at the wrong moment, again and again.

I want to walk you through what a pullback actually is, why the popular version of this strategy keeps failing the people who trade it, and what I actually look at when price pulls back into a level I care about. This isn’t theory pulled from a textbook. It’s how I read pullbacks every single day in my own trading.

What a Pullback Really Is

A pullback is a temporary move against the dominant direction of price before that direction resumes. Price pushes up, pauses, drifts back down for a while, then continues higher. Or it pushes down, drifts back up, then continues lower. On the surface, that’s all a pullback is.

But that surface description is where most training stops, and it’s exactly where the useful information gets left out. A pullback isn’t just “price going the other way for a bit.” It’s a visible record of which participants stepped in during that move, how they behaved, and what they left behind on the chart. Every candle in that retracement is telling part of the story to someone who knows how to read it. None of it is filler. The pullback itself is data.

The retail version of this strategy treats the pullback as a discount. “Price went up, now it’s cheaper, buy the dip.” That framing misses almost everything that actually matters about why the retracement happened and what it reveals about who was buying and who was getting trapped.

Why the Popular Pullback Strategy Keeps Failing

If you’ve spent any time around trading content, you’ve seen the standard pullback playbook: wait for a retracement to a moving average, wait for a Fibonacci level like 50% or 61.8%, or wait for price to tag a trendline drawn across a couple of swing points. Then enter in the direction of the original move.

The problem isn’t that these tools are useless. It’s that they’re public, mechanical, and applied the same way by hundreds of thousands of traders at the same time. When that many people are watching the same retracement level and placing orders around it in the same predictable way, that behaviour becomes something the market can be relied upon to produce and something it can just as reliably punish.

This is the pattern I keep coming back to across every strategy I write about on this blog, including in my breakdown of the breakout and retest strategy: the moment a technique becomes public and mechanical, it stops being an edge and starts being crowd behaviour that gets exploited. A pullback strategy based on a fixed Fibonacci percentage or a generic moving average isn’t reading the market. It’s reading a rule that thousands of other screens are also reading, at the exact same time, with the exact same expectation.

That’s why so many “buy the pullback” entries get taken out almost immediately, price dips just a little further than expected, the stop gets hit, and then the original move resumes exactly as the retail trader expected, except they’re no longer in the trade. That isn’t bad luck. It’s a predictable outcome of trading a level that too many other people are watching in the same mechanical way.

Why Pullbacks Aren’t About Trend Structure

A lot of pullback material, including some of the more “advanced” versions of this strategy, will tell you to check trend structure first. Confirm the sequence of higher highs and higher lows, and only once that’s intact do you allow yourself to look at the pullback. That still sounds disciplined. It isn’t. It’s the same mechanical checklist thinking as a fixed Fibonacci retracement, just moved one step earlier in the process.

What actually qualifies a pullback to be traded has nothing to do with whether a sequence of swing points looks tidy on your chart. It has to do with whether you understand where price is actually going. Not “the trend is up so it probably continues up.” Real professional understanding, built from reading how the three groups of market participants are behaving, of what’s likely to happen next. That’s not something a swing-point checklist can give you. It’s built through direct training, under someone who already reads the market this way.

Once you have that understanding, a pullback becomes tradeable in one specific circumstance: when it reaches a key reversal level. That can happen inside a clean trend. It can just as easily happen without one. The trend isn’t the qualifying factor. Whether the pullback is interacting with a level that genuinely matters, and whether you understand where price is headed once it gets there, is what actually decides whether the pullback is worth acting on.

What a Pullback Actually Shows You

Here’s where I diverge sharply from how pullbacks are taught almost everywhere else. A pullback is not just a pause. It is the visible footprint of three groups of market participants interacting with each other, whose specific identities and behaviours I keep for my mentees rather than laying out publicly here. What I can tell you is that how price moves during that retracement, how it slows, how it compresses, how it approaches a level, tells you a great deal about which of those groups is currently in control and which is being drawn into a position it will later regret.

This is a completely different way of looking at a retracement than “price came back to the 50% level, so I’ll buy.” You’re not looking for a number. You’re watching behaviour. And behaviour, unlike a fixed percentage, can’t be gamed by thousands of traders drawing the same line on the same chart.

Key Reversal Levels During a Pullback

The place I actually pay attention to during a pullback is what I call a key reversal level. This is not the same thing as a textbook support or resistance line, and it’s not the same as a supply or demand zone the way most retail material describes them. If you want the full breakdown of why I treat these concepts as fundamentally different things, I’ve covered it in detail in support and resistance zones in forex.

A key reversal level is a proprietary read built from how price has previously behaved at a given area, combined with the structural context around it, rather than a line drawn from two touches on a chart. When a pullback approaches one of these levels, I’m not just checking whether price “reacted” there before. I’m reading how the retracement itself is behaving as it approaches that level, whether it’s slowing in a way that reflects genuine participant behaviour or barrelling through in a way that tells me the level has already been absorbed.

This is a large part of why two traders can look at the exact same pullback on the exact same chart and come to completely different conclusions. One is measuring a fixed retracement percentage. The other is reading how price is actually behaving at a level built from real structural history.

Professional Alignment: Bringing the Pieces Together

I don’t trade a pullback off a single signal, and I’d caution you strongly against ever doing that. What I look for is Professional Alignment, the point where genuine directional understanding of where price is going, a key reversal level, and the behaviour of the pullback itself all point in the same direction at the same time.

When only one of those pieces lines up, I stay out. A pullback into a key reversal level with no real understanding of where price is going behind it is a guess, even if the level itself looks right. Being right about direction with no meaningful level for the pullback to interact with is also incomplete, you might be reading the market correctly and still have nothing concrete to act on. It’s only when multiple pieces of the picture align that a pullback becomes something worth acting on rather than something worth watching.

This is also where I’d push back on the idea that pullback trading needs to be tied to a specific session. It doesn’t. A pullback that shows genuine Professional Alignment can appear during any session, and restricting yourself to trading pullbacks only during one window of the day means missing setups that have nothing to do with the clock and everything to do with what price is actually showing you.

Volume Analysis: Confirmation, Not a Signal on Its Own

Once I see Professional Alignment building around a pullback, I’ll use volume analysis as a final layer of confirmation within that key reversal level, never as a standalone reason to enter. Volume on its own, without the structural and behavioural context around it, tells you very little. It’s only meaningful once you already know you’re looking at a genuine key reversal level inside a properly aligned structure. At that point, volume analysis can add real confidence. Used before that, it just adds confusion to a decision that isn’t ready to be made yet.

The Execution Stage: Where Professional Thinking Matters Most

This is the part most pullback strategies get completely backwards. Retail material treats execution as a mechanical checklist: risk 1% per trade, use a fixed stop distance, move to breakeven after X pips. Those are position management habits, not trading decisions, and they don’t tell you anything about whether the pullback in front of you is actually worth acting on.

The execution stage of a pullback trade is where professional thinking, applied with professional knowledge of how these levels actually behave, matters more than at any other point in the process. It’s the difference between reacting to a retracement because it “looks like” a textbook setup, and recognising, from real experience reading how price behaves at key reversal levels, that this particular pullback carries genuine weight. My specific entries and the exact decisions I make in the moment are something I reserve for my mentees, but the principle holds for anyone: the quality of your execution depends entirely on the quality of your understanding, not on how disciplined you are about a fixed set of mechanical rules.

Common Mistakes Traders Make With Pullbacks

The most common mistake is treating every retracement as an entry opportunity. Not every pullback interacts with a key reversal level, and not every pullback happens inside a structure worth trading. Entering simply because price has “come back a bit” is how traders end up trading randomness instead of trading levels that actually matter.

The second mistake is anchoring to a fixed percentage. Waiting religiously for a 50% or 61.8% retracement means you’re trading a number that thousands of other charts are also displaying, rather than trading what price is actually doing at a level built from real structural context.

The third mistake is reacting to a retracement without any real understanding of where price is actually going. Watching the pullback in isolation, with no directional read behind it, leaves you with no reliable way to tell a genuine setup apart from a pullback that’s about to turn into a full reversal against you.

How to Actually Learn to Read Pullbacks Properly

None of this comes from watching enough charts eventually. Reading pullbacks the way I’ve described here, recognising key reversal levels, reading Professional Alignment, using volume analysis correctly, and applying real professional thinking at the execution stage, is not information that circulates on YouTube or in public forums. It’s the kind of understanding that gets passed on directly, under the right mentor, and it can click far faster than most traders expect once it’s explained properly rather than pieced together from scattered public sources.

If you want to build this skill set from the ground up, my Forex Training Course covers exactly this, and it works whether you’re picking up trading for the first time or you’ve already been trading for years and want to see the market the way I do. If you’d rather learn a complete, standalone approach built around one strategy that can make you profitable on its own, Learn to Trade in 5 Days is built for exactly that.

Final Thoughts

A pullback is one of the most misread setups in all of forex trading, not because it’s complicated, but because almost everyone has been taught to look at the wrong things when reading one. Fixed percentages, generic moving averages, and mechanical entry rules will keep producing the same disappointing results because they’re public, predictable, and already priced in by the crowd trading them.

Reading a pullback properly means reading behaviour, reading structure, and reading how price interacts with a genuine key reversal level, then applying real professional thinking at the moment it matters most. That’s the version of this strategy that actually holds up.

Thanks for reading and have a beautiful day!
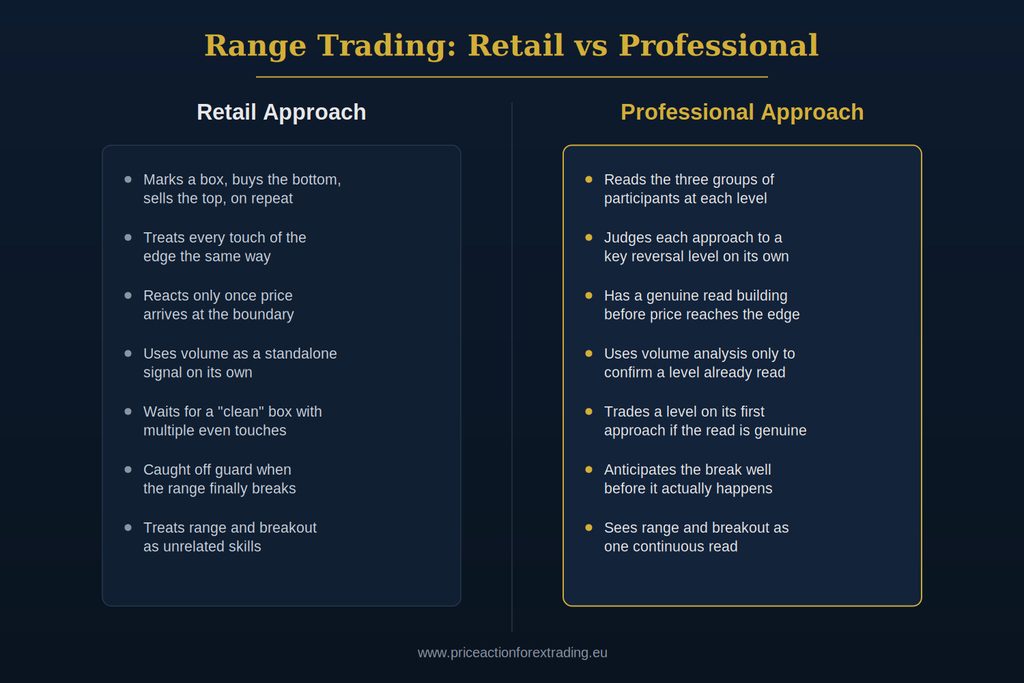
False Breakout Strategy in Forex: Why the “False Breakout” Doesn’t Actually Exist

If you have spent any real time in retail trading communities, you have heard the phrase a thousand times. Price pushed through a level, traders piled in, and then it reversed hard and stopped them out. The verdict is always the same: “false breakout.” A strategy gets built around catching the next one. Indicators get added to filter them out. Entire YouTube channels are built on teaching people how to “avoid false breakouts.”

Here is the uncomfortable truth I tell every trader I train: there is no such thing as a false breakout. The market did not lie to anyone. It did not fake a move and then change its mind. What happened was entirely real, entirely intentional, and entirely explainable once you understand who actually moves price and why. The term “false breakout” is not a market phenomenon. It is a coping mechanism, a label retail traders invented so they don’t have to sit with the more uncomfortable conclusion, which is that they misread what was happening in front of them.

This article is going to walk through why that label exists, what is actually taking place when price pushes past a level and snaps back, and how professional thinking replaces the entire “false breakout” concept with something far more useful.

Where the Term “False Breakout” Actually Comes From

Nobody trading with genuine professional understanding of price action uses the phrase “false breakout.” You will not hear it from anyone who actually understands order flow and how the forex market is structured. It is a retail invention, and it exists for a very specific psychological reason.

When a trader enters on a breakout and gets stopped out by a reversal, they have two choices. They can accept that their read of the situation was wrong, that they misunderstood what the price action in front of them was actually communicating, and that the loss was the direct result of a gap in their knowledge. Or they can decide the market did something abnormal, something deceptive, something that was never going to be predictable in the first place. The second option is far more comfortable. It removes responsibility. It turns a knowledge gap into a market quirk.

That is the entire function of the term “false breakout.” It lets a trader keep believing their method is sound while blaming an invented category of market behaviour for the outcome. Once you accept that framing, you stop looking for the real explanation, and you stay stuck at the same level of understanding indefinitely.

What Is Actually Happening When Price Reverses at a Level

Every single push through a key reversal level that then turns around is the direct result of participant behaviour at that level. Price does not move randomly and it does not move because retail orders alone can push it anywhere meaningful. It moves because of the activity of the market participants who actually have the size and the reason to move it, and those participants operate with intentions that have nothing to do with confirming a breakout for the crowd watching a chart pattern.

At a genuine key reversal level, there are typically three groups of market participants active, each with a different relationship to that price. Who they are and what exactly drives each of them is something I only go into detail on with mentees inside structured training, because it is not information you will find explained accurately anywhere public. But the short version every trader needs to understand is this: what looks like a single breakout attempt to a retail trader watching a candle close is actually several distinct flows of activity overlapping at that price, and the reversal is the visible outcome of that overlap, not a random betrayal of a chart pattern.

Once you can see that, the entire concept of “false” disappears. The move through the level was real. The reversal was also real. Both were produced by the same underlying activity, just at different stages. Nothing was faked.

Why Waiting for “Confirmation” Guarantees You Are Late

Most retail material on this topic tells you to wait for a candle close beyond the level, then wait for a retest, then wait for a second candle to “confirm” the breakout is genuine before entering. This entire sequence is built on the false breakout myth, because its whole purpose is to filter out moves the trader assumes might be fake.

The problem is that by the time all that confirmation has happened, the move that actually mattered is finished. The activity that was going to happen at that key reversal level has already occurred. What retail traders are entering on at that point is the aftermath, not the cause. This is precisely why so many “confirmed” breakout entries still fail: they were never early enough to be part of the actual move, they were reactions to a move that had already played out.

Professional entries happen at the tip of the key reversal level, before the candle closes, not after a sequence of confirmation candles has formed. That requires reading what is happening at the level in real time rather than waiting for the chart to tell a completed story after the fact. This is a skill, and it is trainable, but it cannot be built by memorising a checklist of confirmation candles.

The Language Problem: Why “Rejection” Is Also a Myth

Closely related to the false breakout myth is another piece of retail vocabulary: the “rejection candle.” A long wick forms at a level and traders declare the level “rejected” the price, as though the level itself made a decision. This is the same rationalisation problem wearing a different outfit.

A level does not reject anything. A long wick at a key reversal level is the visible record of specific activity taking place at that price, activity that has a cause and a logic to it once you understand who is behind it. Calling it a “rejection” flattens all of that into a single vague word that explains nothing and teaches the trader nothing. It is descriptive without being useful.

The same applies to the false breakout label. Both terms exist to summarise something the retail trader does not understand into a word that sounds like an explanation. Neither actually is one. If you want to genuinely read candle behaviour at a level rather than label it, you need a framework built around what candles at key reversal levels actually represent, not a glossary of retail shorthand.

Market Structure Makes This Even Harder to See in Real Time

One of the reasons the false breakout myth survives so well is that market structure is genuinely difficult to read while it is unfolding. In hindsight, a chart looks obvious. The push through the level, the reversal, the move back in the original direction, all of it looks clean and predictable once the candles have closed and the outcome is known.

In real time it is a completely different problem. You do not get the benefit of hindsight, and you are watching activity form without knowing yet how it resolves. This is precisely where retail traders reach for the false breakout label, because in the moment it happened they had no framework for understanding what they were watching, and only after the fact does a story get attached to it. Understanding how market structure actually forms in real time, rather than recognising it only in hindsight, is one of the biggest gaps between retail and professional trading.

What Replaces “False Breakout” in Professional Thinking

If the term itself is retired, what does a professional trader actually do at these levels instead of labelling outcomes after the fact?

The starting point is Professional Alignment: reading whether the behaviour at a key reversal level lines up with everything else you know about the current structure, rather than treating each level as an isolated coin flip between “real” and “false.” A push through a level that has no supporting structure behind it is read completely differently in real time than one that does, and that reading happens before the outcome is known, not after.

The second piece is accepting that the decision-making at these levels is not mechanical. It is not a checklist of candle patterns or a rulebook of confirmation criteria. It is professional thinking applied with professional knowledge of how the three groups of participants typically behave at these prices. That is a different skill entirely from pattern recognition, and it is the actual skill that separates traders who can read these levels from traders who need a label to explain what just happened.

None of this requires years to develop, despite what most retail education implies. Under direct, correct training, traders regularly develop this reading ability far faster than the “it takes years” narrative suggests, sometimes seeing a genuine shift in how they read a level within the same session as the training itself.

The Real Cost of Believing in False Breakouts

The false breakout label is not just an inaccurate description, it is actively expensive to hold onto. Once a trader accepts that some breakouts are simply “fake” and unpredictable, they stop trying to understand the mechanics behind them. Instead, they start building filters: extra indicators, extra confirmation candles, extra rules designed to dodge an outcome they believe is random. None of these filters work particularly well, because they are trying to solve a problem that was never correctly diagnosed in the first place. You cannot filter out something you have mislabelled.

This is also why so many retail traders end up with strategies that feel like they are constantly fighting the market. Every filter added to avoid a “false breakout” also removes valid entries, so the strategy becomes both less accurate and less profitable at the same time. The trader ends up further from professional understanding, not closer to it, because every adjustment reinforces the original false premise rather than correcting it.

Compare that to a trader who has actually been shown, through direct training from a mentor who understands the mechanics, what is genuinely happening at these levels. That trader is not filtering out unpredictability. They are reading a specific, recurring pattern of participant behaviour that has a logic to it every single time it occurs. The difference in outcomes between these two traders is not about discipline or risk management. It is entirely about the accuracy of what each of them believes is actually happening on the chart in front of them.

A Practical Way to Start Reframing These Moves

The next time price pushes through a level you were watching and then reverses, resist the urge to reach for the false breakout label entirely. Instead, ask what the behaviour at that price was actually telling you before the reversal happened. Was there anything in the structure leading into that level that suggested the push was unsupported? Was the level itself one with a real history of significance, or one drawn somewhat arbitrarily because price had touched it once before?

This is a habit shift more than a technical one. It means treating every push through a level as data to be read rather than an outcome to be labelled. Over time this rewires how you look at charts entirely, because you stop dividing moves into “real” and “fake” and start reading them as a continuous, meaningful record of participant activity, where every part of the chart carries information rather than being dismissed once it does not fit a pattern.

If you have been trading breakouts using retail confirmation rules, it is worth comparing that approach directly against how these situations are actually read professionally. I cover this in detail in my article on why most breakout strategies get it wrong, which goes further into how key reversal levels behave when price approaches them.

Where to Go From Here

Retiring the false breakout label is not just a vocabulary change. It is the first real step toward reading the forex market the way it actually behaves rather than the way retail education has taught you to describe it after the fact. Every reversal at a level has a cause. None of them are false. The only thing that was ever false was the assumption that the market owed you a clean, predictable pattern in the first place.

If you want to build this reading ability properly rather than continue collecting labels for outcomes you don’t yet understand, Learn to Trade in 5 Days teaches this from the ground up using a single strategy, built specifically to give you genuine professional understanding of how these levels behave, not another checklist of confirmation candles.

Thanks for reading and have a beautiful day!
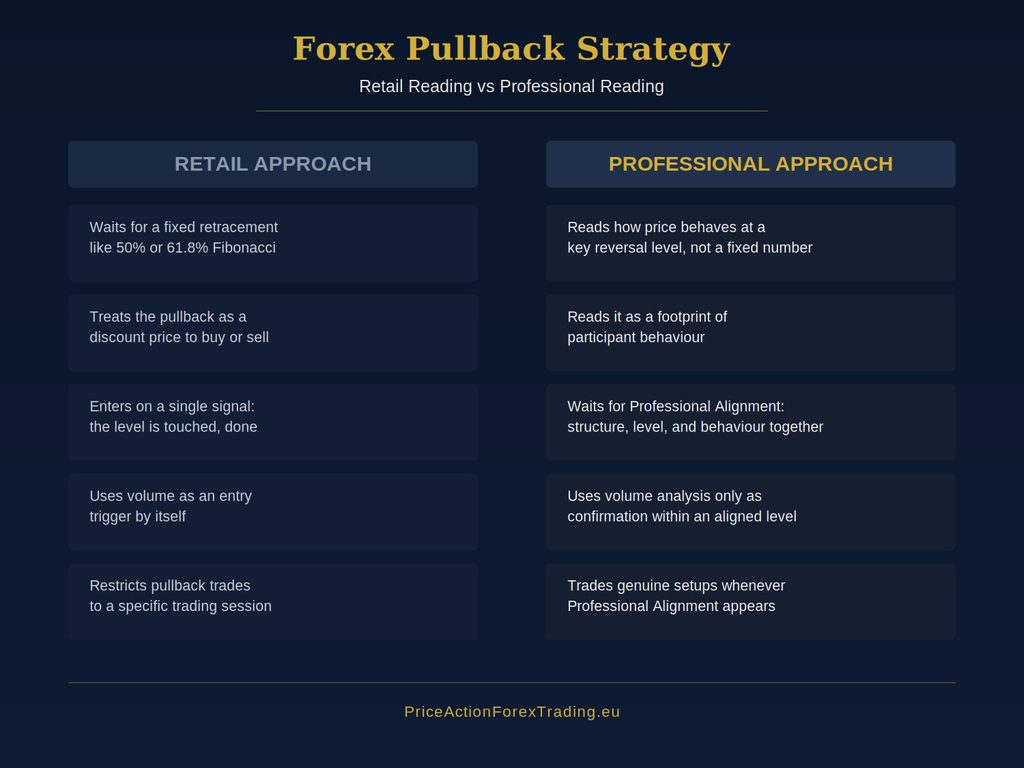
Forex Breakout and Retest Strategy: Why I Don’t Trade It, and What I Do Instead

Search “forex breakout and retest strategy” and you’ll find hundreds of nearly identical explanations: wait for price to break a level, wait for it to come back and test that level, enter when it holds. It’s presented as a professional method. It isn’t one. I don’t trade breakouts and I don’t trade retests, and after years of watching how this pattern actually plays out, I don’t think there’s a genuine professional version of it at all.

What I do use is the fact that thousands of other traders are running that exact playbook, in the exact same spot, at the exact same time. That predictability is worth far more to me than the pattern itself ever could be.

Why “Breakout and Retest” Isn’t a Professional Strategy

Every strategy taught publicly has to be simple enough to explain in a blog post or a ten-minute video. Breakout and retest fits that requirement perfectly: draw a line, wait for it to break, wait for it to come back, enter. It’s teachable, it’s repeatable, and it feels logical. None of that makes it something a professional actually trades.

The reason it doesn’t hold up is that the pattern only works if enough people are unaware of how many other people are trading it the exact same way. Once a level is well known enough to produce a clean breakout, it’s well known enough that a large crowd is doing the same thing at the same price. That crowd isn’t a side detail. It’s the entire reason the pattern shows up in the first place, and it’s also the reason it fails constantly in live conditions.

I’ve written before about what happens mechanically when a level gives way, in my article on the forex breakout strategy and why most traders get it wrong. What I want to be completely clear on here is that recognizing that mechanism isn’t the same as having a strategy built around trading it. Understanding why a crowd behaves predictably at a level, and turning that into a repeatable professional edge, are two very different things.

What’s Actually Happening: Two Crowds at the Same Price

To understand why I don’t trade this pattern, it helps to separate the two groups of traders who show up around every well-known level. Range traders place their stops just beyond it, because that’s what every course teaches. Breakout traders place their entries right at it, expecting the break to run. Both groups are reacting to the exact same price, for reasons that have nothing to do with what’s actually happening in the market beyond “the line moved.”

Neither group is wrong to notice the level. The level is genuinely significant, but not in the way the retail crowd expects. What both groups get wrong is assuming that a level being significant means the breakout, or the retest that follows it, is tradeable on its own. It isn’t. What’s tradeable is knowing how those two crowds are positioned, and what that positioning means for everything else happening around it.

Why I Don’t Reveal the Exact Decisions I Make Here

I want to be upfront about something rather than dance around it. I know the predictable behaviour of range traders and breakout traders around a level, and I use that knowledge to inform decisions I make elsewhere on the chart. What those decisions actually are – which conditions I need to see, how I weigh that crowd behaviour against everything else, what I do with it in practice – isn’t something I lay out publicly.

That isn’t me being coy for the sake of it. It’s the same reason a professional in any field doesn’t publish their exact process for free: it’s information built through years of direct training, and it only holds value while it stays scarce. What I teach mentees isn’t a variation of the retail breakout-and-retest rule with better wording. It’s a genuinely different way of reading what that crowd’s behaviour tells you about the market, taught directly, one trader at a time.

The Retail Version Turns Traders Into Liquidity

Here’s the part that retail material never addresses honestly. When you trade the breakout-and-retest pattern exactly as it’s taught, you’re not gaining an edge over the market. You’re becoming a predictable, visible part of it. Your stop sits where every other range trader’s stop sits. Your entry sits where every other breakout trader’s entry sits. You’re not reading the crowd at that point, you are the crowd, and crowds at predictable prices are precisely what gets used by other participants in the market.

This is why so many traders describe the same experience with this setup: the breakout looks clean, the retest looks like it’s holding, and then the move reverses hard right after they’ve entered. It isn’t bad luck repeating itself. It’s the structural weakness of trading a pattern that a large, identifiable group of people are all executing identically.

Market Structure Still Matters Here

None of this means the level itself, or the market structure leading into it, is irrelevant. Understanding how price built its way toward that level, whether the approach was clean or choppy, and what the broader trend was doing beforehand all still matters. I cover how I read that structure in how to identify trend in forex, and the shape of the higher highs and lower lows leading into a level is something I go through in detail in what higher highs and lower lows are actually telling you. Both of those pieces matter here, not because they tell you how to trade the breakout and retest, but because they’re part of the wider picture that actually informs professional decisions – decisions that go well beyond “the level broke, then it came back.”

This Applies in Every Session

One thing I want to be clear on: the crowd behaviour around breakout and retest setups isn’t confined to a particular session. Range traders and breakout traders place their orders around key levels regardless of what time it is. What changes across sessions is the depth of liquidity available once that crowd’s behaviour plays out, not whether the underlying pattern of predictable positioning exists in the first place.

Why Most Traders Never See This

If you’ve traded breakout-and-retest setups and had them fail on you repeatedly, it’s not because you executed the pattern badly. It’s because the pattern itself was never a professional method to begin with – it’s a widely distributed piece of retail education that creates a crowd, and crowds at known prices are something other participants in the market can act on. No amount of tightening your entry rules or waiting for a “cleaner” retest changes that underlying structure.

This is exactly the kind of gap between public information and professional understanding that direct training closes. It isn’t a matter of studying more chart examples on your own. It’s a matter of being shown, directly, what a level actually represents once you stop treating the breakout and the retest as tradeable events in their own right.

Where This Fits Into a Wider Approach

Reading crowd behaviour around a level is one piece of a much larger picture I build for every decision, not a standalone setup. That’s the core of what I teach in my Learn to Trade in 5 Days course – a complete, standalone way of learning to read the market properly, not a short introduction meant to funnel you elsewhere. Traders can be genuinely profitable from that course alone. For the full framework I apply across every situation, including how I actually use the behaviour of breakout and retest traders rather than trading alongside them, my Forex Training Course covers that in depth, and it’s built to suit new and experienced traders alike.

Bringing It Together

Breakout and retest isn’t a professional strategy, and I don’t trade it as one. What I do is recognise that a large, predictable crowd trades it exactly as it’s taught, and I use the knowledge of how that crowd is positioned as one input into decisions I make elsewhere. The exact detail of those decisions is something I keep for the traders I train directly, because that’s where genuine value in this business actually lives – not in a public rule anyone can copy, but in understanding what the public rule does to the people who follow it.

If you’ve been trading this pattern and wondering why it keeps failing you in the exact same way, that’s your answer. The pattern was never the edge. Knowing what it does to everyone trading it is.

Thanks for reading and have a beautiful day!
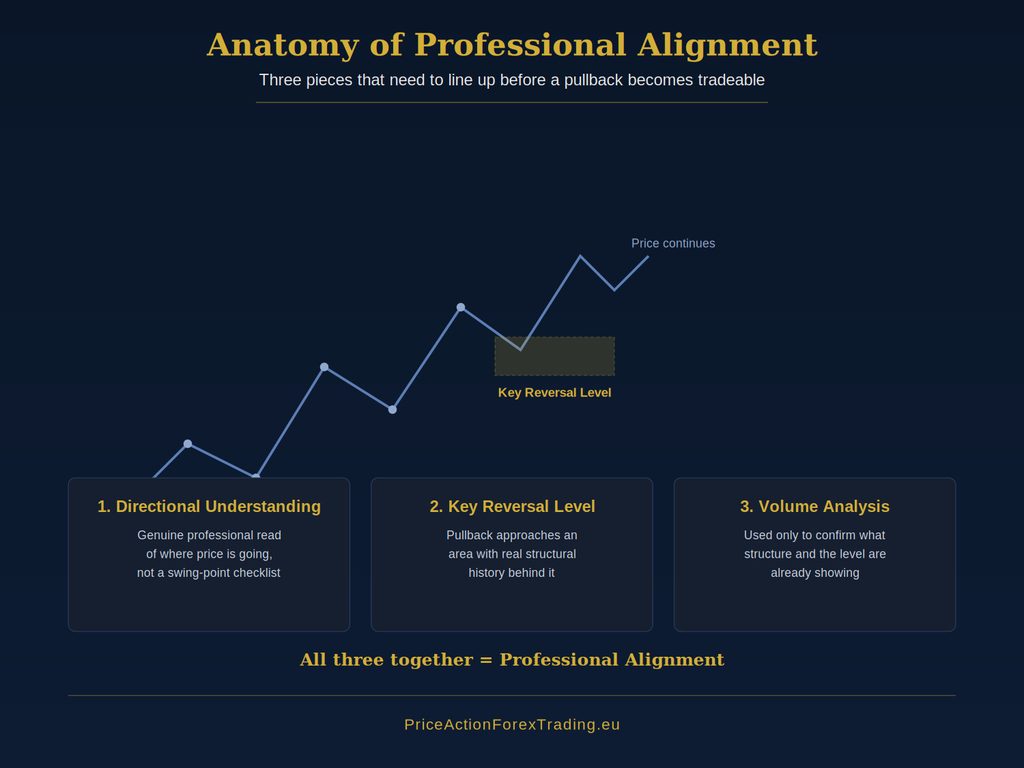
Forex Breakout Strategy: Why Most Traders Get It Wrong and What Actually Works

Breakout trading is one of the first strategies almost every new trader tries, and one of the first strategies that quietly destroys their account. The idea sounds simple enough: price has been stuck inside a range, it finally pushes through a line on the chart, and you jump in expecting the move to run. In practice, most breakout trades end the same way – price pokes through the line, traders pile in, and within a few candles the whole move reverses and stops them out.

I want to walk you through why that happens, what a breakout actually represents when you understand who is really moving price, and how I approach these situations differently than the retail crowd does.

What Retail Traders Think a Breakout Is

The public version of breakout trading goes something like this: draw a horizontal line at an obvious high or low, wait for a candle to close beyond it, and enter in the direction of the break. Some variations add a volume spike as extra confirmation, or a retest of the line before entering.

On paper this looks logical. A price level has been respected multiple times, so a decisive close beyond it must mean something has changed. The problem is that this entire approach is built on a level that thousands of other retail traders can see on the exact same chart, using the exact same indicators, drawn the exact same way. If you can spot that line in five seconds, so can everyone else running the same course or the same YouTube tutorial.

That’s precisely why I don’t use ordinary support and resistance the way it gets taught publicly. I’ve written in detail about what actually happens at those obvious lines in my article on support and resistance zones and what retail actually does there, and the same logic applies directly to breakouts. If a level is popular enough for thousands of traders to place orders around it, it becomes a target, not a launchpad.

Why Most Breakouts Fail

Here’s what tends to happen at a well-known level. Retail traders who were trading the range place their stop-loss orders just beyond it, because that’s what every course teaches. Breakout traders, at the same time, place their entry orders in the same spot, expecting the level to give way and momentum to follow. Both groups are clustering their orders around one price.

When price finally reaches that area, there’s a concentration of liquidity sitting right there, waiting to be used. Price pushes through, triggers the cluster, and then has nothing left to sustain the move because the very traders who would have kept it going have already been filled or stopped out. What looks like a “false breakout” on a retail chart is, from where I stand, a completely predictable outcome once you understand whose orders are sitting at that price and why.

This is where my framework differs from what gets taught in most courses. I don’t think in terms of support and resistance lines that get broken or held. I think in terms of key reversal levels – specific price areas where the balance of activity from the three groups of market participants who actually move this market shifts direction. That distinction matters enormously for how you read a breakout, because a key reversal level isn’t just a line that price crosses. It’s an area that tells you something about who is in control before the candle even finishes forming.

The Professional View of a Breakout

When I look at a chart, I’m not asking “did price close beyond the line.” I’m asking what the candles leading into that area are telling me about which of the three groups of market participants is active, and whether what I’m seeing lines up with the story the higher timeframe has already been telling me. When several pieces of the picture point in the same direction, I call that Professional Alignment – and it’s this alignment, not a single broken line, that tells me whether a move beyond a key reversal level has real weight behind it or is simply liquidity being swept before price reverses.

This is also where trend context matters. A breakout that goes with the underlying structure of the market behaves very differently from one that goes against it. If you haven’t already, it’s worth reading my piece on how to identify trend in forex, because most retail definitions of trend are built on the same flawed logic as their breakout entries – obvious highs and lows that everyone else is watching too.

I also pay close attention to how the market has been building higher highs and higher lows, or lower highs and lower lows, in the price action leading up to a key reversal level. I go into this in more depth in my article on what higher highs and lower lows are actually telling you, but the short version is this: the structure leading into a level tells you far more about what’s likely to happen than the break itself does.

Volume Is Confirmation, Never a Signal on Its Own

A lot of retail breakout systems lean heavily on volume spikes as proof that a move is real. I use volume too, but only as confirmation inside a key reversal zone, never as a standalone reason to enter. Volume tells you activity increased. It doesn’t tell you which of the three groups caused that activity, or why. Treating a volume spike as a signal by itself is how traders end up entering directly into a liquidity sweep, which is the single most common way breakout trades go wrong.

Inside a key reversal level, once I already have Professional Alignment pointing in a direction, a shift in volume can add weight to that read. Outside of a proper zone, it means very little on its own, and I ignore it completely at that point. Of course, in any case, a trader needs professional knowledge to read the volume shifts correctly. They all carry a different meaning depending on what kind of volume change happened exactly.

How I Actually Time the Entry

This is the part that surprises most traders I mentor. I don’t wait for a candle to close beyond a level and then chase the move. By the time that candle has closed, the professional entry has usually already passed, and you’re buying into the same liquidity event that just cleared out the traders who were positioned too early.

Instead, I’m watching for the professional entry to develop at the tip of the key reversal level, often before the candle has even finished forming. If that candle later happens to close looking like a pin bar or some other shape from a retail pattern list, that’s coincidental. The shape isn’t the signal. The professional entry method is the signal, and the resulting candle shape is just what’s left behind once that method has already been applied. This is a completely different way of reading price than waiting for confirmation after the fact, and it’s one of the core things I work through with the traders I train directly.

Breakouts Work at Any Time, Not Just Certain Sessions

One thing I want to be clear about: a properly read key reversal level and a genuine Professional Alignment can appear during any session, at any hour. I don’t teach my traders to only look for breakout setups during London or New York hours, because the underlying method isn’t session-dependent. What does change from session to session is liquidity – how much volume is available to support a move once it starts. A breakout during a thinner session can still be entirely valid; it simply means you should expect the move to develop with less depth behind it, not that the setup itself is somehow less legitimate.

This is a common misconception that gets repeated across retail forums: the idea that certain strategies only “work” during specific windows of the day. The professional strategy itself doesn’t change. Only the amount of liquidity backing the move does (but not necessarily).

What a Genuine Key Reversal Level Actually Looks Like

Traders often ask me how to tell a key reversal level apart from an ordinary line drawn across old highs and lows. The honest answer is that it takes proper training to see it reliably, but I can describe the shape of it. A genuine key reversal level isn’t defined by a single touch or a round number. It’s defined by how the three groups of market participants have behaved in that price area across multiple visits, and whether the story told by price action leading into it is consistent with what happens once price arrives there again.

This is also why market structure is so difficult to read in real time without professional understanding. It’s usually obvious once you look back at a chart with hindsight, but identifying it while price is still forming is a different skill entirely, and it’s the part most retail definitions skip over completely. A key reversal level only becomes useful once you can read it as price is developing, not after the candle has already closed and the opportunity has passed.

Common Mistakes I See Traders Make With Breakouts

The most common error is entering purely because price closed beyond an obvious line, with no read on which market participants were actually driving that move. The second most common is treating every retest of a broken level as automatic confirmation, when in reality a retest into a heavily used level is often just the second half of the same liquidity event playing out.

The third mistake, and probably the most damaging long term, is trading breakouts in isolation from everything else on the chart. A breakout doesn’t exist in a vacuum. It only means something in the context of the trend, the key reversal levels around it, and whether the story the price action is telling lines up across those pieces. Trading a breakout signal on its own, disconnected from that broader picture, is exactly why so many traders describe this strategy as unreliable. It isn’t the strategy that’s the problem. It’s trading it without the professional understanding that makes it work.

Why This Requires a Different Kind of Training

I didn’t figure any of this out from a retail course or a YouTube channel. I learned to read breakouts this way through direct training from my mentor, and the shift in how I saw these setups happened far faster than I expected going in. Once you’re shown how to actually identify the three groups of market participants and read a key reversal level properly, breakout trading stops being a coin flip and starts being something you can read with real confidence, often within the same day you’re shown how.

That’s a large part of why I built my Learn to Trade in 5 Days course around this exact kind of professional understanding rather than another list of retail patterns to memorize. It’s a complete, standalone way of learning to read the market properly, not a taster course meant to funnel you into something else. If you want the fuller picture beyond a single strategy, my Forex Training Course covers the broader framework I use across every type of setup, breakouts included.

Bringing It Together

Breakout trading isn’t a broken strategy. It’s a strategy that gets taught badly, using obvious lines that every retail trader can see and act on at the same time. Once you stop looking at breakouts as a line to wait for and start looking at them as a moment where you can read which market participants are actually in control, the entire setup changes. You stop chasing closed candles and start entering where the professional edge actually exists – before the shape has even finished forming.

That shift doesn’t happen by staring at more charts on your own. It happens through proper training, applied directly, from someone who can read what you can’t yet see.

Thanks for reading and have a beautiful day!