Every retail trader learns the same list at some point: flags, pennants, triangles, wedges. String enough candles together and eventually one of these shapes appears on the chart, and you’re told that when it does, the trend is “pausing before continuing.” Draw two lines around the pause, wait for a breakout of the shape, and you’ve got yourself a continuation trade.
I spent years believing this too, before I received direct training from my mentor, Robert Taylor, that reframed almost everything I thought I knew about how continuation actually works in this market. What I want to walk you through here isn’t a rejection of the concept of continuation – trends absolutely do continue, constantly – but a rejection of the idea that a visual shape is what causes it, or that spotting the shape is what should trigger your entry.
The Problem With Naming Shapes After They’ve Already Happened
Here’s something that should bother you more than it probably does: you can only label a flag, a pennant, or a triangle once it has finished forming. The lines that define the pattern aren’t visible until price has already drawn most of the pattern out. By the time you can confidently say “that’s a bull flag,” a meaningful portion of the move you wanted to catch has already happened without you in it.
This is the quiet flaw in almost all continuation pattern education. It teaches you to recognize completed structures, not to anticipate developing ones. And market structure is genuinely difficult to identify in real time – it only looks obvious in hindsight, on a chart that has already closed. A continuation pattern taught this way is a description of the past dressed up as a signal for the future.
I’m not saying flags and triangles don’t exist as visual phenomena. They do, and you’ll see them on every chart you look at. What I’m saying is that the shape itself carries none of the information that actually matters. The shape is a symptom. The cause is something else entirely.
What Actually Drives a Trend to Continue
Price in this market isn’t the result of a simple negotiation happening between two sides. It’s driven by three distinct groups of market participants, each with their own behaviour, their own timing, and their own reasons for being in the market at any given moment. Understanding how these three groups interact – who is active, who is stepping back, who is about to become dominant – is the actual mechanism behind why a trend keeps going instead of reversing.
This understanding isn’t something you can pick up by staring at chart shapes on YouTube or in a forum thread. It’s the part of trading that most public education, and frankly most paid courses, never actually teach, because it isn’t something the person teaching genuinely understands themselves. It’s the core of what I try to pass on inside my Forex Training Course, and it’s the single biggest difference between a trader who is guessing at shapes and one who is reading the market.
Once you can genuinely read what these three groups are doing, a continuation trade stops being about finding a pattern and starts being about recognizing that price is likely to keep moving in a given direction – and then waiting for the right place to act on that read.
Where the Pullback Actually Matters: Key Reversal Levels
This is where most of the retail approach to continuation falls apart in practice. Retail traders are taught that a pullback only “counts” once the trend has printed a certain sequence of higher highs and higher lows, or once the flag or channel has drawn itself out cleanly. That’s a checklist, not an understanding.
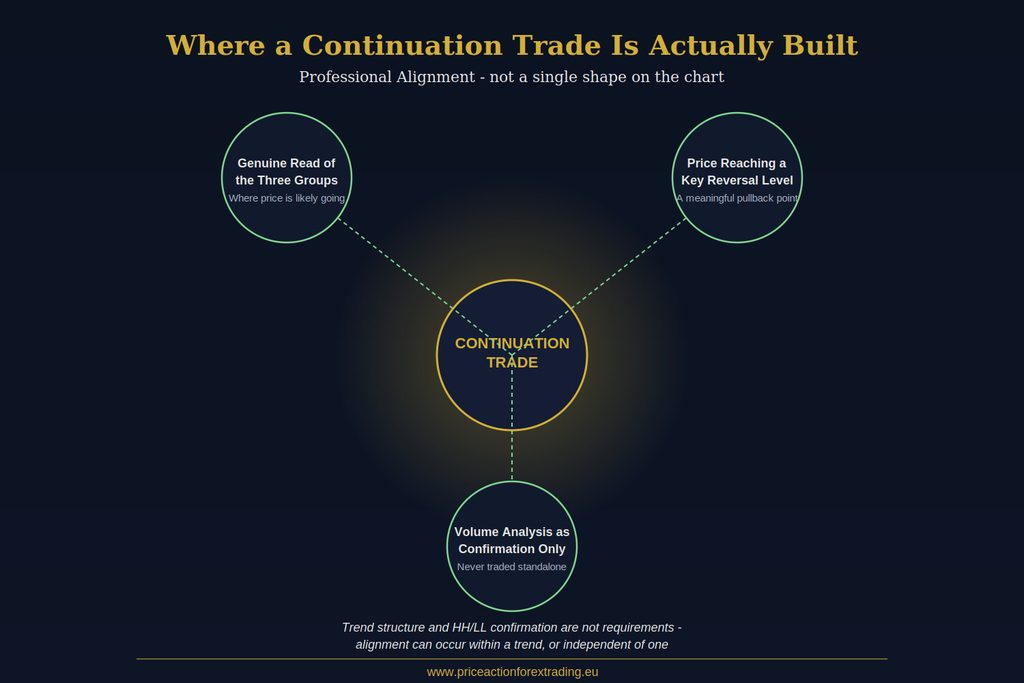
In my approach, what actually qualifies a pullback to be traded has nothing to do with whether a tidy HH/LL sequence exists beforehand. It comes down to two things converging: a genuine read of where price is going, built from watching the three groups of participants, and that pullback reaching a key reversal level. When those two things align, the trend structure around it becomes almost irrelevant. This can happen inside an obvious, well-established trend. It can just as easily happen when there’s no clean trend structure at all. I’ve written in more detail about how I treat these levels in my article on support and resistance zones, and the same logic applies directly here – a key reversal level doesn’t need a textbook trend sitting behind it to be valid.
I’m not going to speculate here on exactly why a key reversal level holds where it does. That mechanism is something I keep for mentees, because it’s tied directly into how you read the three groups, and it isn’t something you can shortcut with a generic explanation. What I can tell you is that it isn’t about participants “losing conviction” or a level “getting weaker.” Those are retail rationalizations for something they don’t actually understand, applied after the fact to make a chart story sound coherent.
Professional Alignment: Why One Signal Is Never Enough
A shape on a chart is a single data point. Professional Alignment is what happens when several independent factors point the same direction at the same time – the read on the three participant groups, the location relative to a key reversal level, and how price is actually behaving as it approaches that level. None of these factors alone is a trade. Together, they’re what separates a professional continuation entry from a retail guess dressed up as a pattern.
This is also why I don’t treat volume in isolation. Volume analysis has a place, but only as confirmation inside a zone where Professional Alignment is already present – never as a standalone trigger. If volume is telling you something but nothing else lines up, you don’t have a trade. You have one data point pretending to be a decision.
Entry Timing: Why Waiting for the Breakout Costs You the Trade
Retail continuation strategies almost universally wait for price to close beyond the pattern’s boundary before entering. That candle close is treated as “confirmation.” The problem is that by the time that candle has closed, the professionals who actually moved price to that point have already been positioned for some time.
I enter at the tip of the key reversal level itself, before the candle closes – not after a shape confirms, and not after a boundary breaks. If the resulting candle happens to look like a pin bar or some other recognizable formation afterward, that’s coincidental. It’s not the method, and it’s not what I’m watching for. The method is the read, the level, and the timing – not the shape the candle leaves behind once it’s done.
This is one of the hardest habits for traders coming from a retail background to unlearn, because it feels uncomfortable to act before there’s visual “proof.” But visual proof, by definition, only exists after the opportunity has already been taken by someone else.
A Note on Breakouts and Retests Within Continuation Setups
You’ll often see continuation patterns marketed alongside breakout-and-retest entries – wait for the pattern to break, wait for price to come back and retest the broken boundary, then enter. I’ve written a full breakdown of why I don’t trade breakout and retest as a standalone method, and the same reasoning applies to continuation setups built around it. I read the crowd behaviour around these retests and use it to my advantage, but the specific decision-making behind how I act on it isn’t something I lay out publicly. It’s reserved for those I train directly.
Common Mistakes I See With Continuation Patterns
The most common mistake is treating pattern recognition as the entire strategy rather than one small, late-arriving piece of information. A close second is assuming continuation setups only work during certain sessions – they don’t. A professional read works at any time of day or night; the only thing that changes with the session is the liquidity behind the move, not whether the setup itself is valid.
Another mistake worth naming: traders assume that if a “continuation pattern” fails to continue, something abnormal happened – a “false breakout,” in the language most people reach for. I’ve explained elsewhere why the false breakout doesn’t actually exist as a distinct phenomenon – it’s a label retail traders apply when their read on the three groups was wrong from the start, not evidence that the market did something unusual.
What This Looks Like on a Real Chart
Picture a pair that has been climbing for several hours. A retail trader watching this move will start drawing converging trendlines the moment price starts to slow down, hunting for the pennant shape to complete so they can mark a breakout level above it. They’ll sit and wait, sometimes for dozens of candles, for that shape to resolve.
I’m not looking at the slowdown as a shape in progress. I’m looking at whether the pause is happening into a key reversal level I already had marked out, and whether what I understand about the three groups tells me buying pressure is likely to resume from there. If those two things are present, I don’t need the pennant to finish drawing itself – I already have what I need to act, and I’ll be positioned before the shape retail traders are waiting for has even become visible. By the time their pennant “confirms” with a breakout candle, I’m already deep into the move.
This is also why two traders can look at the exact same chart, at the exact same moment, and come away with completely different conclusions. One is pattern-matching a shape from a textbook. The other is reading behaviour. They are not doing the same activity, even though they’re staring at the same candles.
Continuation Doesn’t Require a Perfect Trend
One more point worth stressing, because it trips up a lot of traders coming from a retail background: continuation setups aren’t reserved for markets in a clean, obvious trend. I’ve written before about how higher highs and lower lows are frequently misread by traders looking for tidy confirmation before they’ll act. A market can be choppy, directionless-looking, or halfway through building structure, and a genuine continuation opportunity can still be sitting right in front of you if the read on the three groups and the location at a key reversal level are both present. Waiting for a textbook-perfect trend before you’ll consider a continuation trade means you’ll miss a large share of the opportunities that are actually there.
Why This Isn’t Something You Pick Up Slowly Over Years
There’s a persistent idea in trading education that this kind of skill takes years to develop, that you should be patient with plateaus and treat losses as part of a long, gradual arc. I don’t subscribe to that framing, and I don’t think it’s honest. Under the right mentor, with direct, hands-on training, corrections in how you read the market can happen fast – sometimes within a single session. The years-long timeline exists because most people are trying to reverse-engineer this understanding from public sources, forums, and pattern-recognition courses that were never going to get them there in the first place.
If you want to shortcut past the pattern-naming stage entirely and start learning to read what actually drives continuation, my Learn to Trade in 5 Days course teaches this from a professional market perspective using one strategy in depth – not as a preview of something bigger, but as a complete, standalone approach traders can be profitable with on its own.
Bringing It Together
A flag, a pennant, or a triangle is not a strategy. It’s a shape that appears, after the fact, on charts where a trend happened to continue. The actual reasons a trend continues have nothing to do with the geometry you draw around old candles – they come down to genuinely understanding the three groups of participants moving price, recognizing when a pullback reaches a key reversal level, and requiring Professional Alignment before you ever consider pulling the trigger.
Retail education will keep teaching the shapes because they’re easy to draw and easy to sell in a course preview. Reading the market the way I do took real, direct training to develop – and it’s the only version of “continuation pattern trading” I’d ever put my own money behind.
Thanks for reading and have a beautiful day!