
If you search “engulfing candle forex strategy” you’ll find hundreds of articles telling you the same thing: spot a big green candle swallowing a small red one, and you’ve found your signal. Enter on the close, set your stop below the low, done.
I traded that way for years. It never worked consistently, and it wasn’t because I was reading the shape wrong. It’s because the shape was never the thing that mattered in the first place.
In this article I want to walk you through what an engulfing candle actually is, why the retail version of this “strategy” keeps failing traders who execute it perfectly, and what I actually look for when one shows up on my charts. If you’ve read my article on what price action actually is, you already know where I’m going with this: it’s never the pattern in isolation, it’s what the pattern is telling you about who’s actually moving the market.
What an Engulfing Candle Actually Is
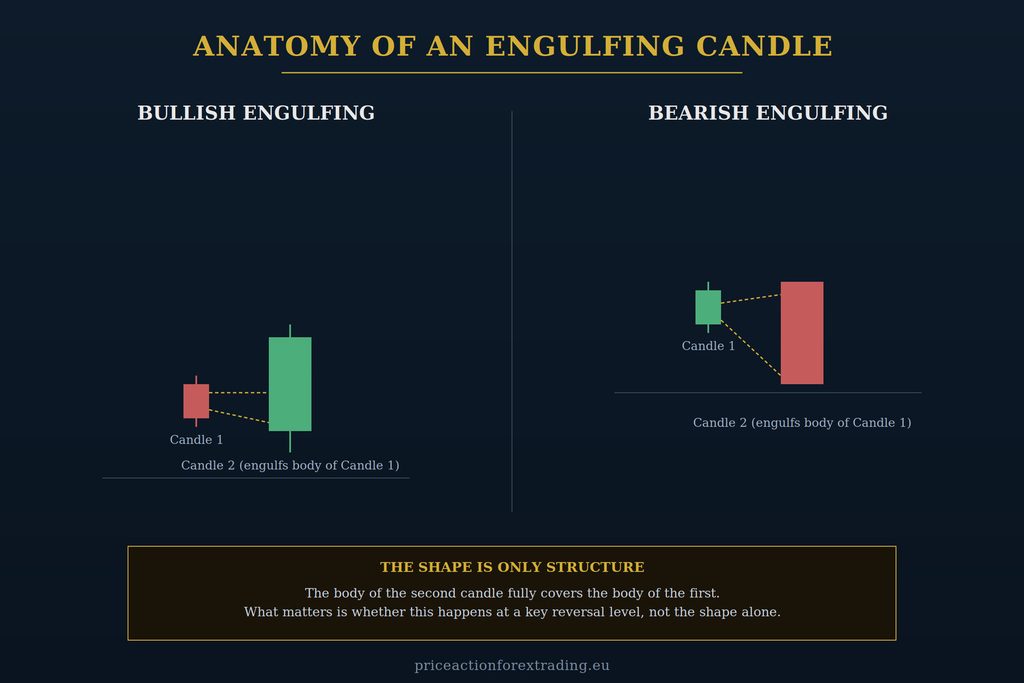
Mechanically, it’s simple. A bullish engulfing candle forms when a candle’s body fully covers the body of the candle before it, closing higher than the prior candle opened. A bearish engulfing candle is the mirror image: a large down candle whose body swallows the smaller up candle that preceded it.
That’s it. That’s the entire definition. No indicator, no lagging confirmation, nothing fancy. You can see it happen in real time as the second candle forms and closes beyond the range of the first candle’s body.
Where things go wrong is in what traders are taught to do with that information the moment they see it.
The Retail Version of This Strategy
Most educational content treats the engulfing candle as a standalone entry signal. The instructions usually look something like this: wait for the pattern to close, check that the body is a certain size relative to the prior candle, maybe glance at an oscillator for extra confirmation, then enter.
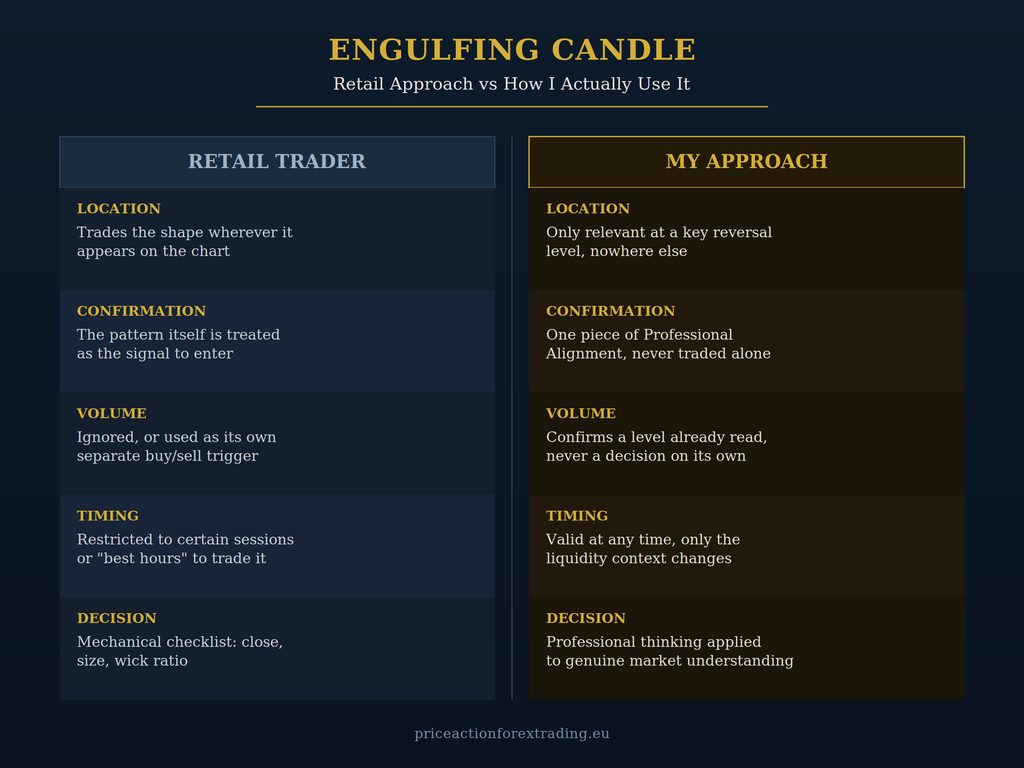
The problem isn’t that this process is complicated. It’s that it treats a candle shape as though it has meaning independent of where it forms. An engulfing candle in the middle of a random stretch of price and an engulfing candle at a genuine turning point look identical on a chart. Retail methodology can’t tell the difference between them because it was never designed to. It’s pattern recognition, not market reading.
This is the same mistake I see across almost every popular “strategy” retail traders are taught, whether it’s continuation patterns, breakouts, or pullbacks. The shape gets treated as the signal. It never is.
What the Engulfing Candle Is Actually Telling You
An engulfing candle is a readable event. Within a single session, price moved decisively enough in one direction to erase and overtake the entire range of the prior candle. That’s not nothing. But what it tells you depends entirely on the context it happens in.
The market moves the way it does because of the three groups of market participants active in it at any given time, and how their behaviour is currently aligned. I won’t get into the specifics of who those groups are or how I read their behaviour here. That’s the core of what I teach directly, and it’s the part that took me years of working alongside a professional mentor to genuinely understand rather than fake with rules and checklists.
What I can tell you is this: an engulfing candle only becomes meaningful when it forms at a key reversal level. Not a line I drew because price touched it twice. A level built from genuine understanding of where these participant groups are likely to act. When an engulfing candle forms there, it’s a piece of evidence, one part of what I call Professional Alignment, which is the convergence of several things pointing at the same conclusion before I’ll actually take a trade.
Away from a key reversal level, the exact same candle shape is just noise dressed up as a signal. It’s not that the price data is meaningless there, it’s that this particular structure isn’t telling you what retail educators claim it’s telling you.
Where Volume Fits In
A lot of engulfing candle content leans on volume as a secondary confirmation tool: big candle, big volume, must be real. I understand the appeal of that logic, but it’s backwards in how it’s usually applied.
Volume doesn’t tell you a level is good. Volume confirms a level I’ve already identified through genuine reading of participant behaviour. It’s supporting evidence for a read I’ve already made, never a standalone trigger that turns an ordinary candle into a valid one. If you’re using volume to decide whether to trade an engulfing candle rather than to confirm a decision you’ve already reached, you’re using it the wrong way round.
Why “Bigger Is Better” Isn’t the Right Filter
Another common rule is to only trade engulfing candles above a certain size, on the logic that bigger equals stronger. Size on its own tells you very little. A large engulfing candle in the wrong location is still in the wrong location. A modest one that forms exactly at a key reversal level, aligned with everything else I’m reading in that moment, matters far more than a dramatic one sitting in open air.
This is where mechanical checklists fall apart. Professional trading isn’t a set of measurements you run through. It’s professional thinking, applied to genuine market understanding, in the moment a setup forms. That’s the part no checklist can replace, and it’s also the part that improves fastest under direct training rather than years of solo backtesting.
Engulfing Candles and Reversals
Because of their shape, engulfing candles get grouped almost automatically with reversal trading, and there’s a reason for that instinct. When I’m reading a potential reversal at a key level, an engulfing candle forming there can be exactly the kind of price behaviour I’d expect to see if my read on the participant groups is correct.
But it’s not a reversal signal by itself, any more than it’s a continuation signal by itself. The same shape can show up inside a trend, at the edge of a range, or after a pullback into a level. What determines whether it’s worth acting on isn’t the pattern category you’ve mentally filed it under. It’s whether it’s happening exactly where and how your reading of the market says it should.
Where This Fits Into a Bigger Structure
If you’ve spent time reading about key reversal levels on this site, this will sound familiar. Nearly every piece of price behaviour I care about, whether it’s a candle shape, a pullback, or a momentum shift, only becomes actionable in the context of a level I’ve already identified through genuine market reading. The engulfing candle is no exception. It’s one more piece of evidence that either supports or contradicts what I already believe is happening at that level.
This is why I never teach candle patterns as their own isolated topic. Treating an engulfing candle, a pin bar, or any other shape as a self-contained strategy misses what actually makes trading decisions reliable: the level it forms at, and the professional understanding of participant behaviour that made that level worth watching in the first place.
Common Mistakes I See With This Pattern
A few things come up repeatedly when I look at how retail traders apply engulfing candle setups.
The first is trading them anywhere they appear rather than restricting attention to levels that actually matter. If you’re marking every engulfing candle on your chart, you’re looking at dozens of “signals” a week, and the vast majority of them mean nothing.
The second is treating the close of the candle as an automatic trigger regardless of what else is happening. A candle closing beyond the prior range doesn’t override everything else you know about where price is and why.
The third is session restriction: the belief that this pattern only “works” during London or New York hours. It works, or doesn’t, based on whether the underlying conditions are right, not the clock. Liquidity context shifts through the day, but the read itself isn’t tied to a session window.
The fourth, and probably the most common, is expecting the pattern to be predictive on its own. It isn’t. It’s confirmatory, and only when everything else already points in the same direction.
Bullish vs Bearish Engulfing: Does the Direction Change Anything?
Not really, beyond the obvious. A bullish engulfing candle tells you buying pressure within that session was strong enough to erase the prior candle’s range and then some. A bearish engulfing candle tells you the same thing in the opposite direction. The mechanics are mirrored, and so is the analysis.
What doesn’t change between the two is the question that actually matters: where did it happen. A bullish engulfing candle forming at a key reversal level where I’d expect buying interest to show up is worth attention. The exact same bullish engulfing candle forming in the middle of an established move, away from any level I’ve identified, tells me very little beyond “buyers were active that session,” which on its own isn’t something I can build a trade around.
I’d caution against treating one direction as inherently more reliable than the other, too. I’ve seen traders convince themselves that bearish engulfing candles “work better” on a certain pair, or that bullish ones are more reliable during a particular part of the day. That’s usually a small sample size doing the talking – a self deception so to speak. The read doesn’t change with direction. Only the context you’re reading it in does.
Why Backtesting This Pattern Rarely Tells You Much
If you’ve ever tried to backtest engulfing candles as a standalone strategy, you’ve probably noticed the results are inconsistent at best. Some pairs, some periods, some timeframes show a slight edge. Others show none, or a negative one. This isn’t a data problem, and it isn’t a matter of needing a bigger sample size or a cleverer filter.
It’s because the pattern was never the variable that mattered. A backtest built purely around candle shape treats every engulfing candle as equivalent, when in reality the vast majority of them are just noise and a small minority form at genuinely significant moments. Mixing those together and running statistics on the combined set will always produce a muddy result, no matter how much historical data you feed it. You can’t backtest your way into professional market reading, because the thing that makes a setup valid isn’t mechanically identifiable from price and volume data alone. It requires the kind of understanding that comes from direct training, not from a spreadsheet.
How I’d Suggest You Approach It
If you want to actually use engulfing candles well, stop looking for them everywhere. Start by learning to identify genuine key reversal levels first, because without that step, nothing else here matters. Once you can find those levels reliably, watch how price behaves as it reaches them. An engulfing candle forming there, alongside other signs of Professional Alignment, is worth paying attention to. One forming in open space, no matter how large or dramatic, isn’t.
This is exactly the kind of thing that’s difficult to learn purely from articles, including this one. Reading about a level is not the same as developing the eye to spot one in real time, under pressure, with your own money on the line. That’s the gap direct training closes fastest. In my Forex Training Course, I walk through exactly how I read these situations, level by level, so you’re not guessing at which engulfing candles are worth your attention and which aren’t.
If you’d rather get there faster with a single focused approach, my Learn to Trade in 5 Days course teaches one complete method end to end, including how candle behaviour like this fits into a genuine professional read of the market. You don’t need years to get this right. Under the right training, this kind of understanding can click far faster than most traders expect.
Final Thoughts
The engulfing candle isn’t a bad tool. It’s a real, observable piece of price behaviour that genuinely means something, just not the thing most retail content tells you it means. Treated as a standalone signal, it’s noise with good marketing. Treated as one piece of evidence within a genuine read of key reversal levels and participant behaviour, it’s useful.
The difference between those two outcomes isn’t the candle. It’s everything you bring to reading it.
Thanks for reading and have a beautiful day!