
Every trader eventually goes looking for a reversal strategy. It usually happens after a string of losses buying breakouts or chasing trends that had already run their course. Someone tells them “just learn to spot reversals” and they go off searching for the perfect candlestick pattern, the perfect indicator combination, the perfect confirmation signal that tells them “this is the top” or “this is the bottom.”
I went through that exact phase myself, years before I understood what price is actually doing. And I can tell you plainly: almost everything taught publicly about reversal trading in forex is built on the wrong foundation. It’s not that the patterns don’t exist. It’s that traders are taught to react to shapes on a chart instead of reading who is actually behind the move.
In this article I want to walk you through how I actually approach reversals – not as a checklist of candle shapes, but as a read of price behaviour at the right location, confirmed the right way, at the right time.
Why Most Retail Reversal Strategies Don’t Work
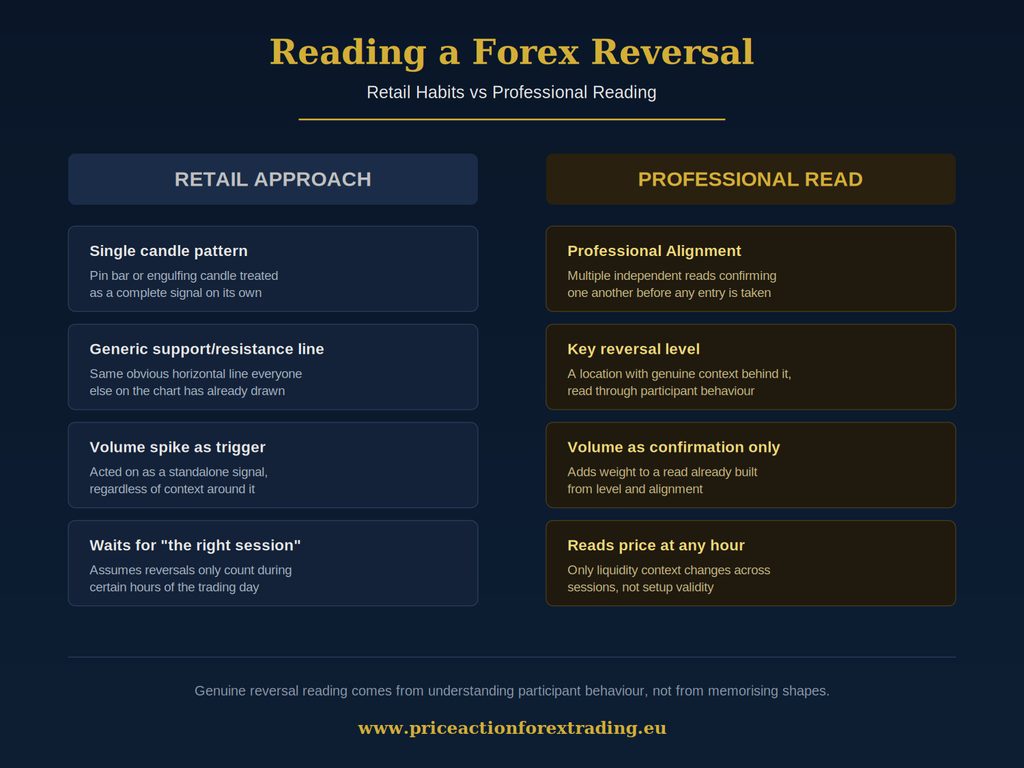
Open any forum or YouTube video about reversal trading and you’ll find the same recycled ideas: pin bars, engulfing candles, double tops, head and shoulders, RSI divergence. None of these are useless as raw observations. The problem is what traders are told to do with them.
Retail education treats these shapes as signals in isolation. See a pin bar at a swing high, sell it. See bullish divergence on RSI, buy it. There’s no depth to the read – just pattern matching applied mechanically, regardless of what’s actually happening underneath the price action.
That’s why the same “reversal pattern” works beautifully in one instance and fails completely in the next. The shape on the chart was never the actual signal. It was a symptom of something happening beneath the surface, and retail education never teaches you what that something is.
I wrote in more detail about this gap between what price action actually communicates and what most people are taught to look for in what price action really means in forex trading, and it’s worth reading alongside this piece if you haven’t already.
What A Reversal Actually Is
A reversal isn’t a candle shape. It’s a shift in who is in control of price at a specific location on the chart. Price doesn’t move because of “buyers versus sellers” in some abstract tug of war – that framing is too simple to be useful. The forex market is made up of distinct groups of participants, each with different reasons for being in the market, different time horizons, and different levels of influence over where price actually goes next.
Genuinely understanding how those groups behave, and being able to read their footprints on a chart, is the actual skill behind spotting a reversal early and with confidence. This is not something you pick up from a YouTube comment section or a free PDF. It’s the kind of understanding that gets transferred directly, from someone who already has it, to someone who doesn’t – which is exactly why mentorship matters so much more than most traders realise. I explain this at length in how to learn forex trading without wasting years on the wrong things.
A reversal, properly read, is simply price reaching a location where the balance of control changes hands. Everything else – the specific candle that finally confirms it, the exact tick where momentum shifts – is downstream of that.
Key Reversal Levels: Where I Actually Look
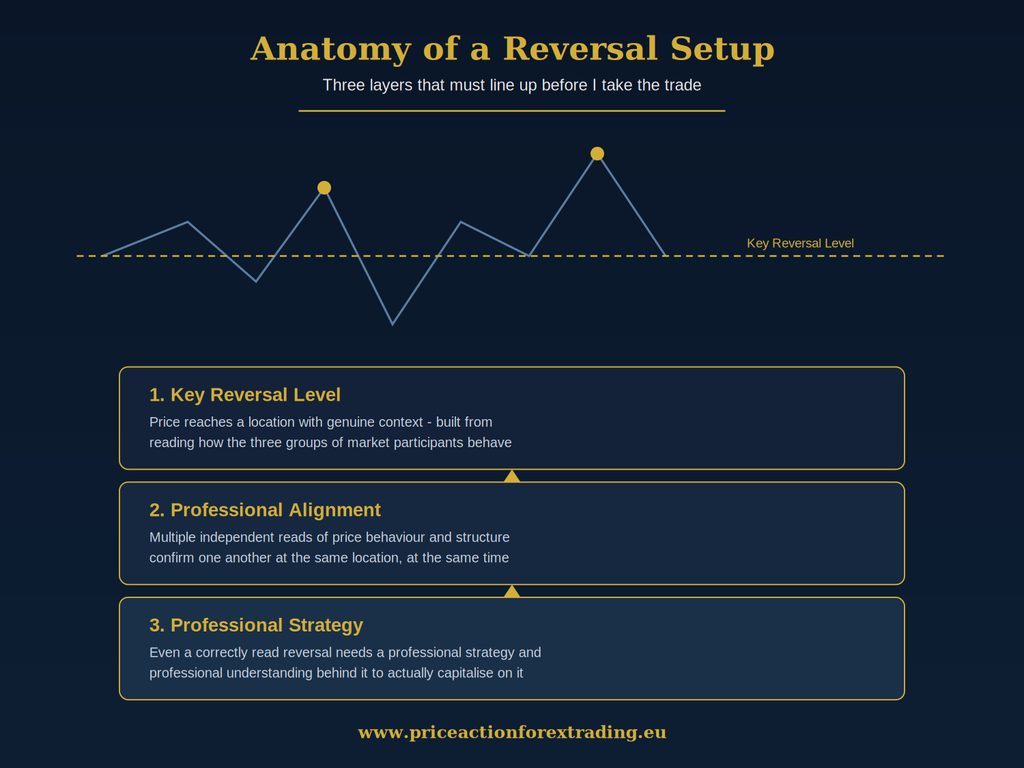
Every reversal I trade happens at what I call a key reversal level. These are not the same thing as the generic support and resistance lines you’ll find drawn on every retail chart. A key reversal level is a location where I have genuine reason – built from experience reading how the three groups of market participants behave – to expect that control of price is likely to change hands.
I’ve written a full breakdown of why the popular idea of drawing horizontal lines at old highs and lows falls apart in practice, in support and resistance zones in forex: what retail actually does there and how I trade against it. The short version: most traders are drawing the same obvious lines, reacting to price in the same predictable way at those lines, and that predictability is precisely what creates opportunity for someone reading the chart properly.
A key reversal level isn’t magic. It’s a location with history and context behind it – the kind of context that becomes obvious once you know what you’re looking for, and stays completely invisible if you don’t. This is one of the areas where I go into real depth inside the Forex Training Course, because it’s genuinely difficult to convey the nuance of reading these levels through text alone. It’s something best absorbed through direct examples and direct feedback on your own charts.
Professional Alignment: Why One Signal Is Never Enough
Here’s where most retail reversal strategies collapse completely: they rely on one single trigger. One candle. One indicator cross. One touch of a line. That’s simply not enough information to act on, and it’s why so many “reversal setups” fail almost immediately after entry.
What I look for instead is Professional Alignment – multiple independent reads of the chart all pointing to the same conclusion, at the same location, at the same time. This might include how price approached the key reversal level, what the surrounding structure looks like, how price is behaving on a shorter timeframe as it reaches the level, and what the broader context of the move suggests about the three groups of market participants currently active.
When these different reads line up, I have a genuinely high-quality reversal setup. When they don’t – when I only have one piece of the picture – I stay out, no matter how tempting the chart looks in isolation. This is the actual discipline behind reversal trading, and it has nothing to do with rigid stop-loss percentages or generic risk rules. It’s about knowing the difference between a setup you actually understand and one you’re just hoping works out.
The Role of Volume At A Reversal
Volume gets thrown around a lot in reversal trading discussions, usually as its own standalone signal – “volume spiked, so the reversal is confirmed.” I don’t use it that way, and I’d caution you against it too.
Volume, on its own, tells you very little. A volume spike can happen for dozens of reasons that have nothing to do with a genuine reversal. What volume is actually useful for is confirming something you’ve already identified through Professional Alignment at a key reversal level. It’s the final layer of confidence, not the trigger itself. If you’ve correctly read that a key reversal level is in play and the alignment is there, a supporting shift in volume behaviour adds weight to the read. Used as a standalone signal, it will mislead you just as often as it confirms.
How Reversals Relate To Pullbacks and Trend
A lot of traders get confused about where reversal trading ends and pullback trading begins, and honestly the confusion is understandable, because both concepts revolve around price reacting at a meaningful location.
The difference comes down to what happens after the reaction. A pullback is a temporary pause within an existing move, where price is still expected to continue in its original direction after reaching a key reversal level. A reversal is a genuine change in that expected direction. I’ve written separately about how I judge pullback validity in forex pullback strategy: why most pullback entries fail and what actually works, and the core principle carries over here too: what matters isn’t whether price satisfies some checklist of higher highs and higher lows beforehand. What matters is whether you genuinely understand where price is going, based on a real read of the three groups of participants, combined with price reaching the right level.
The same applies to reversals. A reversal doesn’t need a textbook trend structure behind it to be valid, and it doesn’t need to wait for some confirmation pattern taught in a retail course. It needs a key reversal level, Professional Alignment, and – when available – supporting volume behaviour. That combination can appear inside a strong trend, at the end of a long move, or completely independent of any clean trend structure at all. If you want to understand trend structure itself in more depth first, I cover it fully in how to identify trend in forex.
Common Mistakes Traders Make Trading Reversals
I see the same handful of mistakes repeated constantly by traders trying to trade reversals on their own, without proper guidance:
Trading every touch of a line as a reversal signal. Not every approach to a level is a reversal. Most of them aren’t. This is exactly why a single candle shape can never be enough on its own.
Ignoring context entirely. Trading a reversal pattern on a random timeframe, at a random price, with no relationship to a genuine key reversal level, is just gambling with extra steps.
Treating volume as a standalone trigger. As covered above, this leads to false confidence at exactly the wrong moments.
Assuming reversals only happen at certain times of day. A properly read reversal setup can appear during any session – London, New York, Tokyo, the overlaps, even the quieter hours. What changes across sessions is liquidity, not whether a genuine reversal can occur. Traders who wait around for “the right session” are missing setups that don’t care what the clock says.
Expecting the market to explain itself in obvious ways. Every detail on the chart matters to someone who can actually read it. Dismissing large sections of price movement as irrelevant “noise” is a habit that keeps traders permanently blind to information that’s sitting right in front of them.
Why This Understanding Doesn’t Come From Public Sources
I want to be direct about something here, because I think it matters more than most trading content admits: you will not find genuine reversal-reading skill on YouTube, on forums, or inside most privately sold courses either. What gets taught publicly is almost always the same recycled set of candle patterns and indicator rules, repackaged with new branding.
Genuine professional understanding of how the three groups of market participants behave, and how that translates into readable reversal setups at key reversal levels, is something that gets passed down directly – from someone who has it, to someone willing to learn it properly. I was fortunate enough to receive that training directly from my own mentor, Robert Taylor, and it changed how quickly I was able to trade with real confidence. You can read more about him and what he meant to my own development as a trader on my tribute page to Robert Taylor.
Under the right mentor, this kind of correction to your reading of the market doesn’t take years. I’ve seen it happen inside a single session of direct training. That’s the entire premise behind the Learn to Trade in 5 Days course – it’s a complete, standalone way of acquiring a real professional understanding of one strategy, reversal-based setups included, without needing to spend years accumulating fragments of information from unreliable sources.
Putting It Together
If you take one thing away from this article, let it be this: a forex reversal strategy built on price action isn’t a list of candle patterns to memorise. It’s the ability to read where a genuine change of control is likely to happen, confirm that read from multiple independent angles, and understand that confirmation isn’t optional – it’s the entire foundation of a trade you can actually trust.
That skill isn’t something you can shortcut with an indicator, and it’s not something that only reveals itself after years of trial and error either. It comes from proper training, applied to real charts, under someone who already knows how to read them. I’d genuinely encourage you to explore what that kind of training actually looks like inside the Forex Training Course if reversal trading is something you want to take seriously.
Thanks for reading and have a beautiful day!