
I am not going to pretend “support and resistance” is a meaningless phrase nobody should learn. It is public knowledge for a reason – it is genuinely how most of the forex-trading population marks up their charts. The mistake is not in knowing what these zones are. The mistake is trading them the way retail is taught to trade them. I do not draw a line, wait for price to touch it, and click buy or sell. What I actually do is ask a different question: given that thousands of retail accounts are staring at this exact same line right now, what are they about to do, and how do I position against it once that behaviour confirms itself.
Let me actually walk through the public playbook first, properly, because you deserve a real answer to the question in the title before I tell you why I do not use it directly.
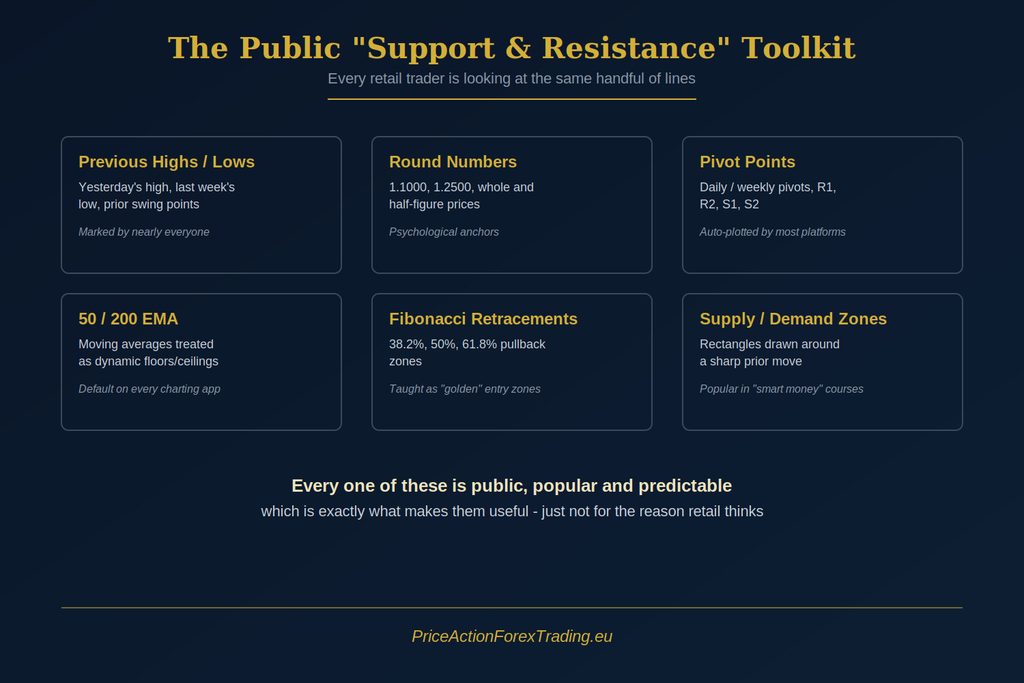
The Public Support and Resistance Toolkit
This is not a secret list. It is taught in nearly every retail course and free video on the subject, and knowing it well is genuinely useful – just not for the reason most traders think.
Previous highs and lows. Yesterday’s high, last week’s low, the swing point from three days ago. Retail traders draw horizontal lines across these and expect price to “respect” them on the next visit, either bouncing off the line or breaking cleanly through it.
Round numbers. Prices like 1.1000 or 1.2500 get treated as psychological magnets. The idea is that enough traders place orders around whole and half figures that the number itself becomes a meaningful zone.
Daily and weekly pivot points. Most charting platforms auto-plot a central pivot along with R1, R2, S1 and S2 using the previous session’s high, low and close. A large chunk of retail traders use these as their entire zone-marking system without drawing anything themselves.
The 50 and 200 period moving averages. Especially on higher timeframes, these get treated as dynamic support and resistance, something price is expected to “test” and react to as it rises or falls.
Fibonacci retracement levels. The 38.2%, 50% and 61.8% pullback zones get taught as high-probability areas to buy a dip or sell a rally inside a larger trend, often described as the “golden zone.”
Supply and demand zones. More recently popularised by “smart money” style courses, these are rectangles drawn around a sharp prior move, with the idea that the same imbalance will draw price back for a reaction later.
None of this is wrong to know. In fact, you should know all of it, because everyone else trading against you knows it too. That is precisely the point I am about to make.
Why I Don’t Trade the Line
Here is where I part ways with the retail model completely. None of those six tools has any actual power over price. A previous high does not “hold” because it is a previous high. A round number does not attract price because it looks tidy on a chart. These lines only appear to work sometimes because of what happens around them, not because of what they are.
What happens around them is a predictable, repeatable pattern of retail behaviour. Because so many traders were taught the exact same six tools I just listed, a large number of accounts end up positioned in nearly identical ways at nearly identical prices. Bounce traders buy just above a previous low expecting a reaction. Breakout traders place buy stops just above a previous high, waiting for a “confirmed break.” Retail traders in both camps place their stop-loss orders in predictable spots – just below the low for the bounce traders, just below the breakout entry for the breakout traders. You do not need insider information to know roughly where retail money is sitting. You just need to know what retail was taught, because I was taught the exact same things once.
I go into how this same gap between what looks obvious and what is actually happening applies to trend reading in how to actually identify trend in forex, and to swing structure in what higher highs and lower lows are actually telling you. The pattern repeats across every part of this subject: the popular explanation focuses on the shape on the chart, and the professional read focuses on the people who put their money where that shape is.
The Inversion Narrative Retail Has Been Sold
Retail education has essentially trained an entire generation of traders around one core expectation at these zones: that price will invert, meaning reverse direction, the moment it touches a well-marked level. Buy the bounce at support, sell the bounce at resistance, or wait for the break and trade the retest in the new direction. Either way, the underlying belief is the same – the level is a decision point where price is supposed to do something predictable.
That belief is exactly what makes these zones tradeable for me, but not in the direction most people expect. When a large number of accounts are all expecting the same inversion, at the same price, using the same handful of tools, you end up with two crowds stacked on opposite sides of one line: one crowd long from the bounce, one crowd long from the breakout, both convinced they are on the right side of the move for different reasons. Both cannot be right, and the market has no obligation to reward either of them just because they showed up with a ruler and drew the same line as everyone else.
What I Actually Watch For
I do not fade every touch of a popular level. That would be its own kind of mechanical, brainless system, just running in the opposite direction of retail instead of alongside it, and it would fail just as often. What I am actually watching for is confirmation that the crowd sitting at a level is trapped, not just present.
That confirmation comes from reading how price behaves once it reaches the zone, not from the zone itself. This is where the idea of Professional Alignment matters, the read on whether several genuine layers of context are agreeing at the same price and the same moment. A level with a large retail crowd stacked on it but no Professional Alignment behind a reversal is not a trade. It is just a crowded line. What I need to see is the price action inside that zone confirming that the trapped side is being forced to react – stop orders triggering, breakout entries failing to hold, the move accelerating away from the crowd rather than in the direction they were positioned for. Volume analysis plays a supporting role here too, confirming that the move away from the level has genuine participation behind it rather than just drifting through on thin activity.
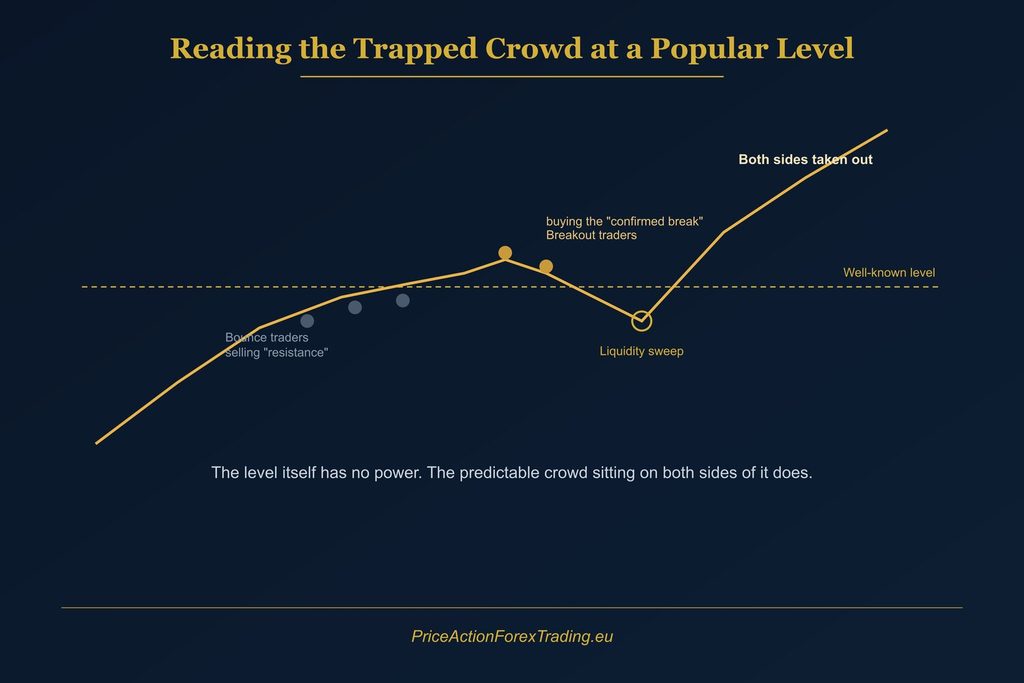
There is also a timing element to this that most traders miss entirely. The trapped crowd does not all get forced out at the same moment. Bounce traders holding underneath a level tend to give up first, once price pushes past their stop cluster. Breakout traders holding above tend to hang on slightly longer, hoping the move resumes, before their own stops eventually give way too. Reading which group is unwinding first, and how much of the move away from the level is being driven by that unwinding rather than by fresh positioning, is part of what separates a genuine read from a coin-flip trade off of a popular price.
A Practical Example
Picture EURUSD approaching a previous weekly high that has been sitting on every retail chart for days. Bounce traders who missed the initial move are watching for a reversal entry underneath it. Breakout traders have buy stops resting just above it, ready to chase a confirmed break. Price finally reaches the level, pushes slightly above it, just far enough to trigger the breakout buy stops and pull in a wave of momentum chasers, then reverses hard back through the level, catching both the breakout buyers on the wrong side and forcing the bounce sellers underneath to abandon their positions as their stops give way too.
That reversal is not magic, and it is not the line “holding” in the retail sense. It is the mechanical result of a large, predictable crowd being positioned exactly where they were taught to position themselves, and the market moving through the one path that removes the most of them from the board. I am not betting on the line. I am reading whether that specific sequence is actually unfolding, and only acting once it has.
The same mechanics play out around round numbers, just with a slightly different crowd composition. Take a level like 1.2500 on GBPUSD. Retail traders have been taught that whole numbers act as psychological magnets, so you get a cluster of limit orders sitting just above and below it – some traders fading the number expecting a reaction, others treating a clean break through it as confirmation of a bigger move. Because the number itself carries no real weight, what usually happens is price probes through it just enough to trigger the breakout crowd, stalls, and then reverses back through the figure, leaving both the fade traders and the breakout traders exposed on opposite sides. The number was never the reason. It was simply where enough people were standing that their reaction became visible.
Why This Is Hard to Learn From a Video
Understanding the six retail tools takes an afternoon. Reading, in real time, whether a crowd at one of those levels is actually trapped or whether the level is going to do exactly what retail expects it to do, is a different order of skill entirely. It requires reading candle behaviour, and professional understanding of the market together, in the moment, not after the fact when the outcome is already obvious on a replayed chart.
This is genuinely difficult to build from public material alone, and I do not think that is an accident. Most free content and even most paid retail courses are built to teach the six tools I listed above, because that is what is easy to package and sell. Almost none of them teach you to read the crowd sitting on top of those tools. I only got sharp at this under direct training from my mentor, Robert Taylor, and it did not take years once someone who actually understood it was watching my reads and correcting them directly. If you are relying on forums and video libraries to get here on your own, you are choosing the slowest possible path to a skill that responds very well to fast, direct feedback. I wrote more about what that gap actually looks like in how to find a mentor worth learning from.
Bringing It Together
If you take one thing from this away from the six tools above, let it be this: knowing where retail draws its lines is genuinely useful information, but only once you stop treating those lines as decision points for your own entries and start treating them as a map of where the crowd is going to be standing. The level does not move price. The people trapped at the level do, once the market forces their hand.
This is exactly the read I teach inside the Forex Training Course, built for traders at any stage who are ready to stop drawing the same lines as everyone else and start reading what happens around them instead. If you want a faster, fully contained path to this specific skill without committing to the full course, Learn to Trade in 5 Days teaches one complete strategy built around exactly this kind of read, and traders have gone on to be profitable from that course alone.
Final Thought
Support and resistance are not myths, and I am not telling you to stop learning them. I am telling you that the six tools above describe where the crowd gathers, not where price is obligated to react. Once you start reading the crowd instead of the line, the entire subject looks completely different, and it stops being a guessing game about whether a level will “hold.”