
If you have spent any time at all researching forex trading, you have run into the term “price action” more times than you can count. It gets attached to YouTube thumbnails, course sales pages, and a thousand Instagram posts of candlestick charts with arrows drawn on them. Ask ten different traders what price action actually means and you will probably get ten different answers, most of them wrong.
So let me give you a straight answer, based on how I actually trade every day, not how the term gets thrown around online.
Price action is the study of raw price movement on a chart, without relying on indicators, to understand what is actually happening in the market and why. That’s the textbook definition, and it’s fine as far as it goes. But it’s also where most explanations stop, and that’s the problem. Knowing the definition doesn’t mean you know how to read it. There’s a huge gap between the retail version of price action and the professional version, and that gap is exactly what separates traders who lose consistently from traders who don’t.
Price Action Isn’t What Most People Think It Is
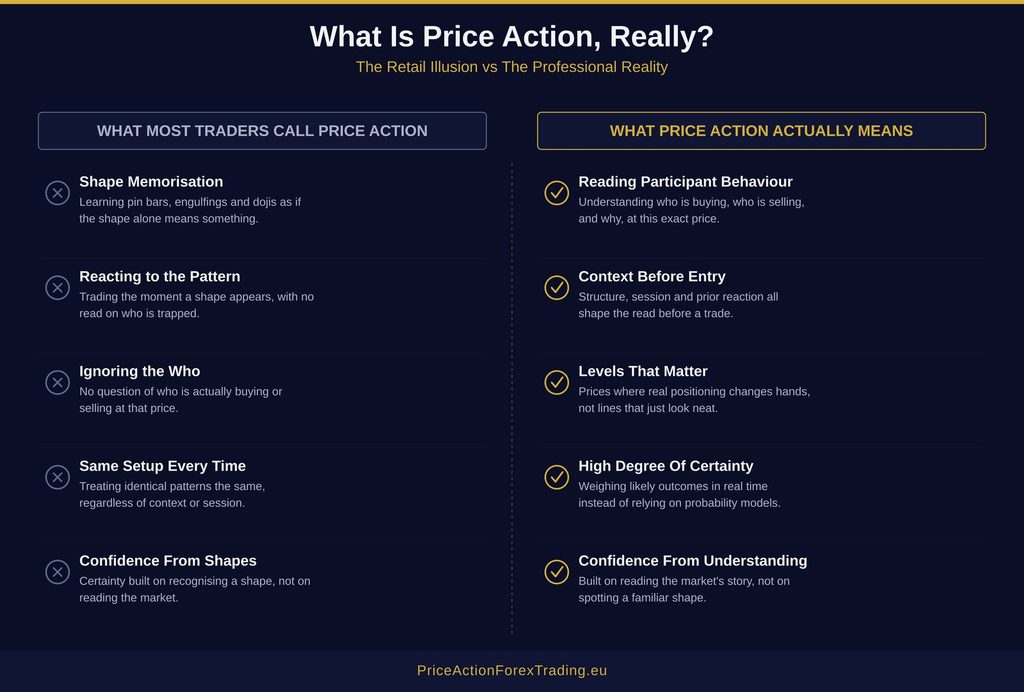
Walk into almost any free price action tutorial and you’ll see the same thing: a pin bar here, an engulfing candle there, a doji at a “key level,” all labelled as if the shape itself is the signal. This is the retail definition of price action, and it’s the version that gets taught to 95% of new traders. It’s also the version that keeps most of them losing money.
The problem isn’t that these shapes don’t exist or never matter. The problem is that memorising what a pin bar looks like tells you nothing about who printed it, why, or what is likely to happen next. A pin bar formed by retail traders panic-selling into a professional buy zone looks identical, on the chart, to a pin bar formed by nothing more than random noise. The shape is the same. The meaning is completely different. If you have covered some of the basics already in my piece on trading forex as a beginner, you’ll recognise this theme, because it comes up again and again: the market rewards understanding, not memorisation.
This is exactly why so many traders can recite every candlestick pattern in the book and still lose money consistently. They’ve learned the vocabulary without learning the language.
What Price Action Actually Means
Real price action is not about shapes. It’s about reading what actually happened on every single candle, in terms of which market participants were acting and how, and understanding why price moved the way it did, not just that it moved.
Every candle on your chart is a record of action, not a shape to be memorised. The forex market is made up of several distinct groups of participants, each with different motivations, different position sizes and different ways of showing up on a chart, and the candle in front of you is the visible residue of what those groups actually did during that period. Two candles that look identical can represent completely different combinations of participant behaviour underneath. I don’t go into the specifics of who those groups are and how to read their footprint on a chart in a public blog post, that level of detail is something I only cover directly with the traders I train, but the principle holds either way: the shape you see is the effect, not the cause. What actually matters is understanding what produced it.
This is the core idea I’ve written about before when discussing the two sides of the forex market. There is a retail side and a professional side, and they are often doing the opposite thing at the same time. Real price action reading is the skill of working out which side is currently in control at a given price, and why.
The Core Elements I Actually Look At
When I say I read price action, I don’t mean I scan a chart for familiar shapes. I mean I’m running through a specific set of questions every time I look at a pair, built from years of screen time and correction from my own mentor. There are five pieces that matter far more than any candlestick pattern on its own.
Understanding direction comes first. You need to know where the price is going to be able to place correct trades. How do you know where is it going? By using your professional understanding. If you know why the price (actually) moves, you can know where is it going to move. Not all the time of course – only in certain cases, but that’s enough. Understanding direction is not the same as reading the current trend. The issue with trends is that by the time you’ve identified it, it may be already over. I sometimes happen to be trading in the direction of the trend, but I don’t specifically look for trends.
Key reversal levels matter next, and I want to be precise about what I mean here, because the term gets misused constantly. I’m not talking about support and resistance, I’m not talking about supply and demand zones, and I’m not talking about trendlines. Those are retail concepts, and they’re not the same thing at all. A key reversal level is a price where the market is likely to turn with a genuinely high degree of probability, identified through an understanding of how professional participants actually operate at that price, not because a line “looks important” on the chart. It also has nothing to do with where retail stop losses happen to be clustered. That’s a different concept entirely, and conflating the two is one of the more common mistakes I see.
Volume analysis is part of the picture too, but not the way it’s usually taught. I don’t read volume the retail way, scanning for spikes or divergences in isolation and treating them as signals on their own. Volume alone is never traded. It only becomes useful as confirmation once price has already reached one of the professional areas I’m already watching and expecting certain behaviour from. In that context, volume adds a layer of confidence to a read I’ve already formed. Outside of that context, it’s just noise.
Session behaviour still matters, but not in the way retail traders often assume. This isn’t about certain setups only being valid during certain sessions, that’s a retail mentality, and a genuine professional strategy can be applied at any time of day or night. What actually changes across sessions are thinking of the participants of the market and how they act. Understanding that difference sharpens your read. It doesn’t restrict when you’re allowed to trade.
Professional alignment ties it all together, and I use that term deliberately instead of the word most retail content uses, because “confluence” has become a checklist word, stack enough indicators and lines together and call it confluence. What I mean is different: multiple genuine pieces of professional evidence lining up at the same price, at the same time, not a single pattern taken in isolation and traded on hope.
Why Two Traders Can Look at the Same Chart and See Different Things
This is the part that trips people up the most. Two traders can look at the exact same chart, at the exact same moment, and reach completely different conclusions, because they’re not actually looking at the same information.
A retail trader sees a candlestick shape and reacts to it. A trader with a genuine professional understanding of the market sees the same candle and reads it as one data point inside a much bigger context: the structure, the session, the proximity to a real level, and what the move likely means about who is in control. Same chart, same candle, two entirely different reads, and only one of them has any edge behind it.
Why Price Action Trading Has Such a Bad Reputation
Take the pin bar, since it’s the poster child of retail price action education, and it’s a good example of exactly where things go wrong. Retail courses teach you to wait for the candle to close, confirm the shape, confirm the wick, and then enter. By the time all of that has happened, the move the pin bar was hinting at has often already started without you. You end up buying after the professional money has already bought. You’re late to a party that’s already begun winding down, and in trading, being late to a good price is functionally the same as being wrong.
What I actually do is different, and the difference is not subtle. I’m not trading pin bars. I’m identifying, often before the candle has even finished forming, the exact price where a reversal is highly likely to happen, and entering right at that tip, sometimes before the shape most people would even recognise as a pin bar exists. Every now and then, what forms afterward happens to resemble a pin bar on the chart once it’s done. That’s a coincidence of the outcome, not the method behind it. The difference between entering at the tip and entering after full confirmation is the difference between getting a genuinely great price and getting a mediocre one, and in this business, price is everything. Get in late, and you’re paying a professional price for an entry the professionals are already exiting.
That’s the real reason price action has such a mixed reputation. It’s not that reading price is unreliable. It’s that most people trading “price action” are reacting to a shape after the opportunity has already been taken by someone faster and better informed.
Common Mistakes That Keep Price Action From Working
Most of the frustration traders feel with price action comes down to a handful of repeated mistakes, and once you see them laid out, they’re hard to unsee.
The biggest one is trading a pattern the moment it appears, without ever checking the structure around it. A pin bar inside a strong trend, against the trend, at a level nobody is actually defending, is not the same trade as a pin bar forming exactly where structure, a real level, and the session all line up. Treated as identical, they will produce wildly inconsistent results, and the trader ends up concluding that “price action doesn’t work reliably,” when really only half the picture was ever being used.
Another common mistake is treating a level as permanently valid just because price reacted there once. Levels lose relevance over time, get retested and weakened, or simply stop being defended once the participants who cared about that price have already been filled. Reading price action properly means constantly reassessing whether a level still matters, not marking it once and trusting it forever.
Then there’s ignoring liquidity context entirely, expecting the same conviction from a level during a dead, illiquid hour as you’d see when real size is moving through the market, and being confused when the reaction is weaker than expected. This isn’t about certain setups being off-limits at certain hours, it’s about understanding that liquidity shifts throughout the day and that shift affects how convincingly a level gets tested. And underneath most of these mistakes sits the same root cause: stacking indicators on top of price because the underlying read was never trusted in the first place. If you need three confirming indicators to take a trade, the price action itself wasn’t actually being read. It was being ignored in favour of something that felt more certain.
How Fast Can You Actually Learn to Read Price Action?
Here’s something I want to push back on directly, because it gets repeated so often it’s practically accepted as fact: the idea that reading price action properly takes years of screen time before it clicks.
It doesn’t have to. What takes years is trying to figure it out entirely on your own, through trial and error, without anyone correcting your read in real time. If you’re staring at charts alone, guessing, and slowly building intuition through thousands of hours of unguided repetition, then yes, that process is slow and unreliable. But that’s a problem with the method, not with the skill itself.
Under the right mentor, corrections happen fast, often in the same session. You take a trade based on a shape you thought meant something, your mentor stops you and shows you what that candle was actually telling you about who was really in control at that price, and that correction sticks. You don’t need to re-learn it through another fifty losing trades. This is exactly the gap I cover in more depth in my article on finding a forex mentor worth learning from: the entire value of direct mentorship is that it compresses what would take years of unguided self-study into a fraction of the time, because someone is correcting your read of the market in real time instead of leaving you to eventually stumble onto the answer yourself.
This is also why I built my Forex Training Course around live market conditions rather than pre-recorded lessons. You can’t learn to read key reversal levels and volume context from a video you watch once. You learn it by having someone with a genuine professional understanding of the market sit with you while price is actually moving, point out what’s happening in real time, and correct your read on the spot. That’s how the skill actually transfers, and it’s how it transfers quickly.
Final Thoughts
Price action is not a set of candlestick shapes to memorise. It’s the skill of reading what the market’s real participants are actually doing at a given price, why they’re doing it, and what that tells you about what is likely to happen next. The retail version, built entirely around pattern recognition, will keep you guessing forever. The professional version, built around structure, key reversal levels, volume analysis, session context, and professional alignment, is what actually gives you an edge.
The good news is that this isn’t some rare talent you either have or don’t. It’s a skill, and like any skill, it responds to direct, competent correction. You don’t need years of guessing alone in front of a chart. You need someone who already understands how the market really works to show you what you’re actually looking at, and to keep correcting your read until it clicks. Once it does, you stop seeing a chart full of shapes, and you start seeing the market for what it actually is: a record of real decisions made by real participants, all telling you a story, if you know how to read it.