
If you’ve spent any time learning to trade, you’ve been told the same thing a hundred times: an uptrend is a series of higher highs and higher lows, a downtrend is a series of lower highs and lower lows, and once that pattern breaks, the trend is “over.” It sounds simple. It sounds like something you could teach a beginner in five minutes.
That’s exactly the problem.
Higher highs and lower lows are real. Structure genuinely does shift, and reading it correctly is one of the most useful skills a trader can develop. But the version most people are taught is a simplified, mechanical shell of what’s actually happening on the chart. It gets traders drawing lines between swing points and calling it analysis, when what they’re really doing is describing history after it has already happened.
I want to walk you through what higher highs and lower lows actually represent, why the textbook definition falls apart in real time, and how I actually read structure shifts as a professional trader.
Why Everyone Learns This Wrong First
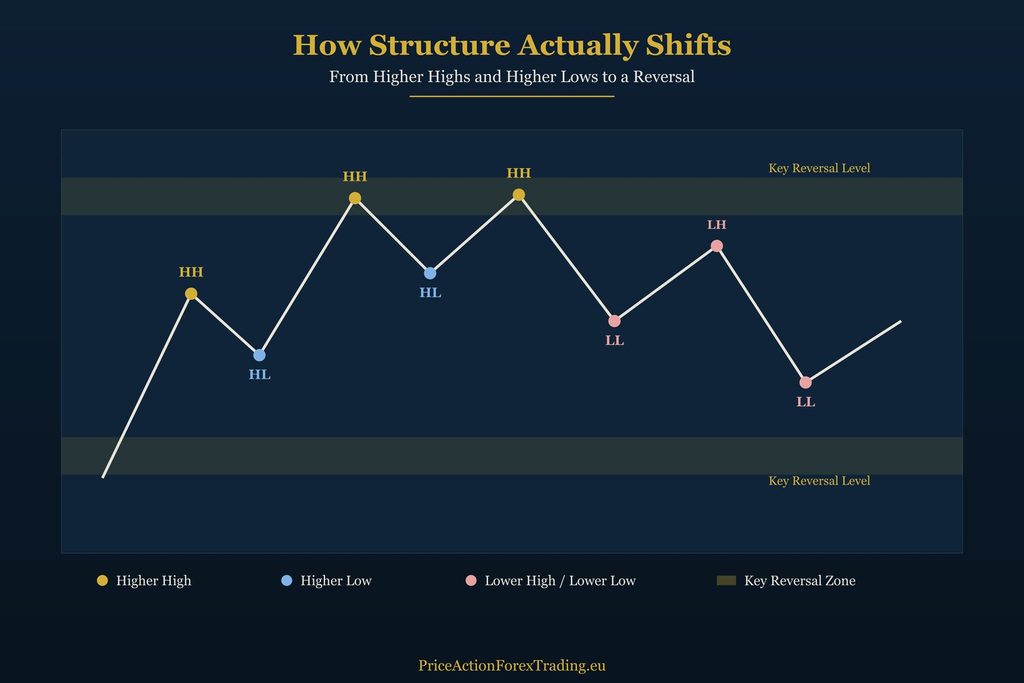
Almost every retail course teaches structure the same way. They show you a chart after the fact, point at the peaks and troughs, and say “see, higher high, higher low, higher high, that’s an uptrend.” It looks obvious in the screenshot. What they never show you is the same chart in real time, candle by candle, with no idea yet whether the next high will actually be higher or whether it’s about to fail.
That’s the part nobody teaches, because it’s the hard part. Genuine market structure is difficult to identify while it’s forming. It only looks obvious in hindsight, once the candles have closed and the pattern has already resolved. If your only training has come from public sources or a course that teaches structure as a backward-looking labeling exercise, you’ve learned to recognize trends after they’ve already paid out, not while they’re happening.
This is one of the reasons I wrote about how to actually identify a trend in forex in more depth. Higher highs and lower lows are a piece of that picture, not the whole picture.
What a Higher High Actually Represents
Here’s where most explanations go wrong from the very first sentence. You’ll read that a higher high forms because “buyers are stronger than sellers” at that point. That framing is too simple to be useful, and it hides more than it reveals.
Price at any given point is being shaped by three distinct groups of market participants, each with different intentions, different time horizons, and different reasons for being in the market at that exact price. Which of those groups is dominant at a given level, and why, is not something you’ll find explained accurately in a YouTube tutorial or a forum thread. It’s the kind of understanding that gets passed on directly, not published for free.
A higher high isn’t just “price went up more than last time.” It’s the visible footprint of one of those groups asserting itself again at a fresh price, and whether that footprint is meaningful depends entirely on where it happens relative to the levels around it. A higher high that forms right into a key reversal level tells you something completely different from one that forms in open space with nothing above it. Treating them as the same event, the way mechanical swing counting does, throws away most of the useful information.
The Problem With Counting Swing Points Mechanically
If you’ve ever tried to trade higher highs and lower lows using a strict, mechanical definition (connect the swing points, wait for a break of structure, enter), you’ve probably noticed it doesn’t hold up well in real conditions. Price rarely moves in the clean, textbook zigzag that the diagrams show. You get overlapping swings, false breaks, and points that only become “valid” once you’ve already missed the move.
This isn’t a flaw in the concept. It’s a flaw in treating every swing point as equally significant, which is what mechanical counting does. Not every high and low deserves the same weight. Some form at meaningless points on the chart. Others form directly at key reversal levels, where the reaction actually tells you something about which group of participants is active there. A professional read weighs each swing point against its location, not just its shape.
This is also why I don’t teach structure as an isolated pattern. It only becomes genuinely useful once you understand what’s covered in what price action in forex actually means, because a higher high or lower low is one piece of price action, not a standalone signal you trade in isolation.
Key Reversal Levels: Where Structure Actually Turns
This is the part that separates a genuinely useful read of higher highs and lower lows from a retail one. I don’t use the words “support” and “resistance.” I don’t talk about a level “getting rejected” or a candle “getting accepted.” That language treats price levels like static lines that either hold or break, when what’s actually happening is far more specific.
I work with key reversal levels: precise areas on the chart where a shift in control between the three participant groups likely to occur. When a higher high forms at one of these levels rather than in open space, that’s meaningfully different information. It tells me the move is arriving somewhere that has mattered before, not just somewhere new.
This is also why structure alone is never enough for me to act. A lower high forming at a key reversal level and a lower high forming randomly mid-range look identical if all you’re doing is connecting swing points. They are not remotely the same event, and confusing the two is one of the most common reasons traders misread a shift in trend before it’s actually happened, or miss one that has.
Professional Alignment: Structure Plus Confirmation
Once I’ve identified that a swing point is forming at a key reversal level, I don’t act on structure by itself. I look for Professional Alignment: multiple pieces of evidence lining up at the same location, with volume analysis used specifically to confirm what’s happening inside that zone, never as a standalone signal on its own.
This matters because volume spikes happen constantly across a session, most of them meaning very little on their own. Used correctly, volume analysis tells you whether real participation is showing up at a level you already had reason to care about. Used incorrectly, as a standalone trigger, it generates constant false signals because it’s disconnected from where on the chart it’s actually happening.
So the actual sequence looks like this: identify a swing point forming near a key reversal level, then look for Professional Alignment through volume analysis and other confirming detail at that specific location, and only then treat the higher high or lower low as meaningful. Every one of those steps requires professional understanding of what you’re looking at, not a mechanical checklist. There’s no substitute for actually knowing what you’re reading.
No Detail on the Chart Is Irrelevant
One habit I try to correct early with traders I mentor is the instinct to filter out most of what’s on the chart and focus only on the “obvious” swing points. Every candle, every small high, every minor low is meaningful to someone reading it correctly. What looks like an unimportant wick to a retail trader might be exactly where one of the three participant groups showed its hand.
This is part of why mechanical structure counting fails so often. It’s built around the assumption that most price action can be filtered out and only the big, obvious peaks matter. In reality, the smaller detail around a key reversal level is often what confirms whether a higher high or lower low is genuine or about to fail. Skipping past it because it looks minor is how traders miss the actual shift while staring right at it.
Does This Work in Every Session?
A question I get often: does reading higher highs and lower lows this way only work during certain sessions, like London or New York? No. A professional read of structure works at any time of day or night, because the principle behind it doesn’t change with the clock. What does change across sessions is liquidity: how much genuine participation is available to confirm a move at a key reversal level.
That means the read itself never changes. What changes is how much weight I give to the confirmation I’m seeing, because a quiet session simply has less of it available. Traders who are told a setup “only works” during a specific window have usually been taught a rule to compensate for not actually understanding what they’re looking at, rather than a genuine principle.
Retail Structure Reading vs Professional Structure Reading
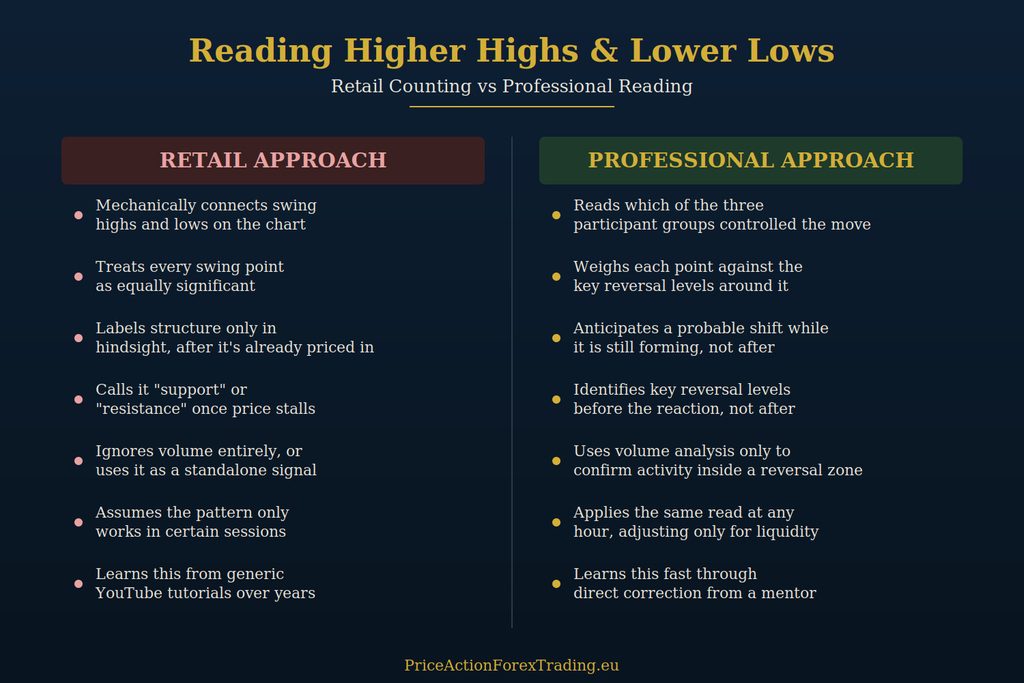
Put side by side, the differences are consistent across almost every trader I’ve worked with before they corrected this:
Retail traders connect swing points mechanically and treat every one as equally important. I weigh each swing point against the key reversal levels around it. Retail traders label a trend as broken only once it’s obvious in hindsight. I look for a probable shift while it’s still forming, using Professional Alignment rather than waiting for confirmation that’s arrived too late to act on. Retail traders use words like “support” and “resistance” once price has already reacted. I identify key reversal levels in advance, because they tend to matter more than once.
None of this comes from years of screen time or from watching enough YouTube videos to eventually notice the pattern yourself. It comes from someone who already reads structure correctly showing you exactly what you’re missing, on your own charts, in real time.
How Fast You Can Actually Learn to Read This
I want to be direct about something, because it gets misrepresented constantly in this industry: you do not need years to learn to read higher highs and lower lows properly. The idea that this takes a decade of screen time, or that you should expect to lose money for a long stretch while you “figure it out,” is guru language designed to make slow progress sound normal. It isn’t normal. It’s what happens when nobody corrects your reads directly.
When I was mentored by Robert Taylor, corrections happened same-day. I’d misread a swing point, he’d show me exactly why, and I wouldn’t make that same mistake again. That kind of direct correction is simply not available from a forum post or a generic course, and it’s the actual reason mentorship accelerates this skill rather than years of trial and error.
If you want to build this understanding properly from the ground up, my Forex Training Course covers structure, key reversal levels, and Professional Alignment in full, and it’s built for traders at any stage, not just people who already have years behind them. If you’d rather get a complete, standalone strategy you can start trading with immediately, Learn to Trade in 5 Days teaches you to read the market professionally through one specific approach, and traders have gone on to be profitable from that course alone.
Bringing It Together
Higher highs and lower lows are real, and they matter. But the mechanical version most traders are taught, connect the swing points and wait for a break, throws away almost everything that makes structure genuinely useful. A higher high forming at a key reversal level, confirmed through Professional Alignment, is a completely different piece of information from one forming in open space with nothing behind it.
Learning to tell the difference isn’t a matter of grinding through years of charts hoping the pattern eventually clicks. It’s a matter of having someone who already reads it correctly show you exactly what you’re missing, and correcting it directly until you see it the same way. That’s the entire premise behind how I teach, and it’s why traders I’ve mentored get there in a fraction of the time the rest of the industry insists is necessary.
Thanks for reading and have a beautiful day!