
“The trend is your friend” has to be one of the most repeated phrases in trading, and also one of the least explained. Everyone tells you to trade with the trend. Almost nobody tells you how to actually identify one before it’s already obvious to the entire retail crowd.
I want to walk you through how I read trend on a chart – not with a stack of indicators, but by reading what price and the participants behind it are actually doing. This is the same approach I cover in more depth inside my Forex Training Course, and it’s the piece most self-taught traders are missing.
Why Most Traders Get Trend Wrong
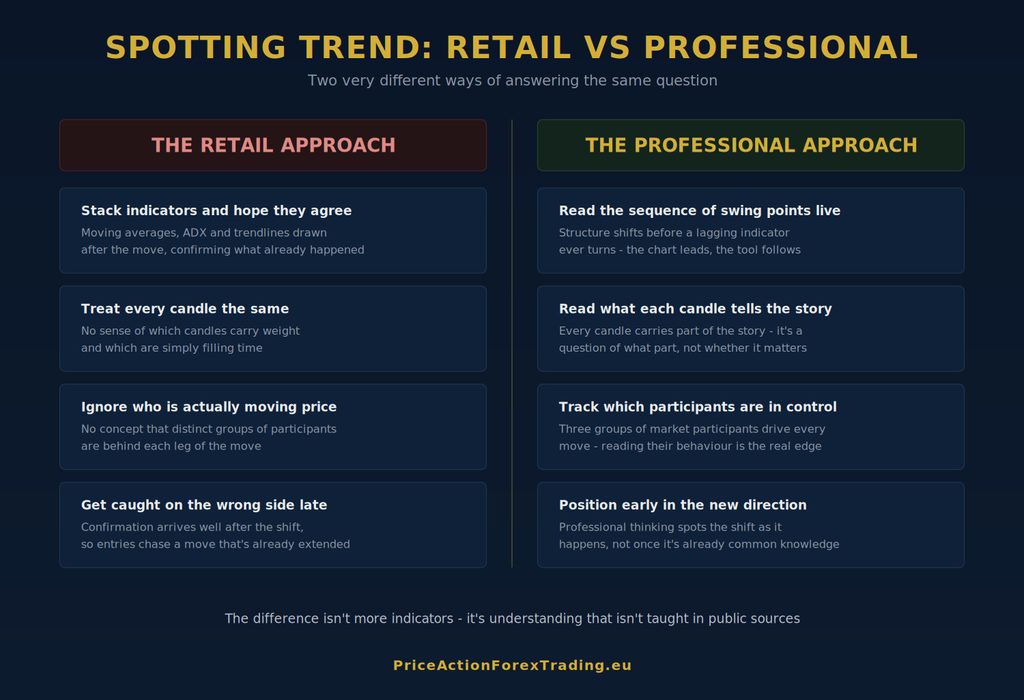
Ask ten retail traders how they identify a trend and you’ll get ten different answers, most of them built around the same handful of tools: a moving average crossover, an ADX reading above a certain number, a trendline drawn by eye. None of these are wrong exactly, but they all share the same flaw – they describe what has already happened, not what’s happening now.
By the time a 50-period moving average turns, or a trendline gets a third touch, the move it’s describing may already be half over. You end up trading a confirmation of the past rather than a read of the present. This is a big part of why so many traders enter trends late, get shaken out on the first pullback, and conclude that “the trend just reversed on me” – when in reality they were never reading the trend itself, only a lagging picture of it.
If you’re newer to this, it’s worth first getting comfortable with the basics I cover in trading forex for beginners, because trend reading builds directly on top of understanding what price is actually showing you.
What a Trend Actually Is
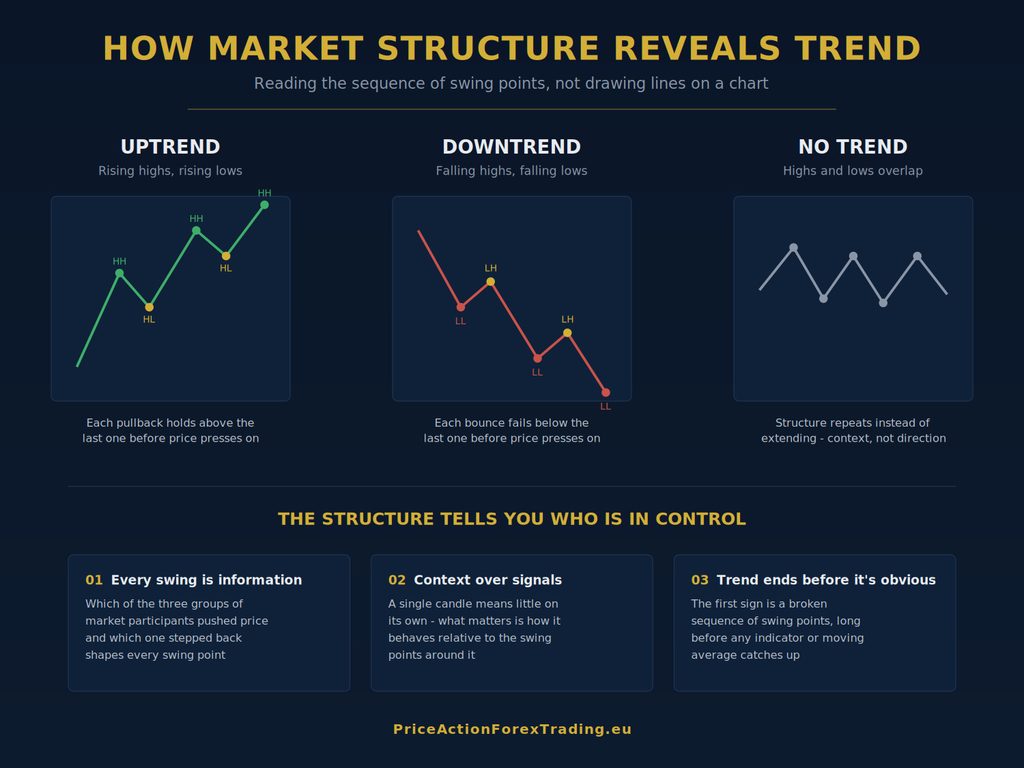
Strip away the indicators and a trend is simply this: a directional sequence of swing points, where each new high and each new low tells you something about who is in control of price.
- In an uptrend, each swing high sits above the previous swing high, and each swing low sits above the previous swing low.
- In a downtrend, each swing high sits below the previous swing high, and each swing low sits below the previous swing low.
- When that sequence breaks down and highs and lows start overlapping instead of extending, you’re not in a trend at all – you’re in a period without clear direction, and that’s just as important to recognise.
This sounds simple, and mechanically it is. The skill isn’t in memorising the definition. It’s in reading, in real time, which swing points are genuine and which are false starts – and that’s where professional understanding of the market separates itself from everything you’ll find in a YouTube tutorial.
I’ve put the three structures side by side below so you can see the difference clearly.
Reading the Market Behind the Structure
Here’s the part almost nobody teaches properly. A chart doesn’t move on its own – it moves because of three distinct groups of market participants interacting with each other, each with different intentions, different size, and different reasons for being in the market at any given moment. Which of those three groups is currently in control is what actually produces the swing highs and swing lows you see on the chart.
This is proprietary knowledge I only go into with my mentees directly, because it’s not something you’ll find explained accurately anywhere public – not on forums, not on YouTube, not in most privately run courses either. Most of what’s taught out there is pattern memorisation dressed up as market analysis. Real trend reading means understanding why one group is pushing price in a direction, why another is stepping aside to let it happen, and what it looks like on the chart the moment that balance starts to shift.
That last point matters more than anything else in this article. A trend doesn’t end when a moving average finally crosses. It ends when the underlying behaviour driving it changes – and that shows up in the structure of the swings well before any lagging tool catches up. Also, if you have professional understanding of the forex market and are able to identify where the price is going with a high degree of certainty, you’ll also be able to predict where a trend shall finish and if it’s still worth trading that trend. This is also the recurring theme in my piece on the two sides of the forex market, which goes further into how this plays out on a live chart.
Every Candle Carries Part of the Story
One habit I try to break in every trader I mentor is the tendency to skim past most of the chart and only pay attention to the obvious, dramatic candles. To someone reading price properly, there’s no such thing as a candle that doesn’t matter. Every candle – big or small, fast or slow – is telling you something about which participants were active and how convicted they were. A trend is built from that accumulation of detail, not from three or four standout moves.
This is precisely why indicator-based trend detection falls short. An indicator averages price down into a single line and throws away all of that detail in the process. When you read the raw structure instead, you keep the information that actually tells you whether a trend has genuine conviction behind it or whether it’s running on fumes.
Step by Step: How I Identify Trend on a Live Chart
Here’s the practical process, broken into stages.
1. Establish the Higher Timeframe Context
I advise you to start from a higher timeframe before zooming into where you’ll actually trade. A daily or 4-hour chart tells you the dominant directional bias – whether the larger sequence of swing points is rising, falling, or stuck in overlap. Trading against that larger context is one of the fastest ways to get caught out, because you’re fighting the group of participants with the most weight behind them.
2. Map the Swing Sequence
On my working timeframe, I mark out the recent swing highs and swing lows. I’m not looking for a perfect textbook pattern – real charts are messier than that. I’m looking for the general sequence: is price making progressively higher structure, progressively lower structure, or repeating the same range?
3. Watch How Price Behaves at Each Level
This is where professional thinking replaces mechanical rule-following. As price approaches a prior swing point, how does it behave? Does it reveal any one of the three groups of participants clearly being in control? This single read – done correctly – tells you more about the health of a trend than any indicator ever will.
4. Confirm With Momentum, Not Just Direction
A genuine trend doesn’t just move in one direction, it moves with a certain rhythm – impulsive legs that cover ground quickly, followed by shallow, orderly pullbacks. When the pullbacks start growing deeper and the impulsive legs start shrinking, that’s often the earliest tell that the trend is losing its underlying power, long before price actually breaks the swing sequence. But, as mentioned before, it’s also important to know where the price is going and if you know that, then you’re in a much better position for trading trends.
5. Reassess Constantly
Trend identification isn’t a one-time judgement you make and then forget about. Markets are dynamic, and the group of participants in control today isn’t guaranteed to still be in control tomorrow. I reassess the structure every time I sit down at the charts rather than assuming yesterday’s read still holds.
Common Mistakes Traders Make When Identifying Trend
Forcing a trend where none exists. When a trader wants to be in a trade, it’s easy to squint at a choppy, overlapping chart and convince yourself you can see direction that isn’t really there. If the swing sequence isn’t clearly extending, respect that and wait.
Confusing a strong single move for an established trend. One large impulsive candle doesn’t make a trend. It takes a sequence of swing points to establish genuine directional control, not a single burst of momentum.
Relying on a single timeframe. A chart can show a clear uptrend on a 15-minute timeframe while sitting inside a much larger corrective move on the daily. Reading trend in isolation on one timeframe, without the wider context, is one of the most common reasons traders get caught trading against the larger current.
Waiting for total certainty. Some traders wait for so much confirmation that by the time they’re convinced a trend exists, most of the move is already behind them. Professional trend reading isn’t about certainty, it’s about probability – recognising the early signs of a shift in participant control and acting on that read with structure and precision, rather than waiting for the crowd to catch up.
Why This Skill Is Rare – and Why That’s the Point
Here’s something worth being honest about: this level of trend reading isn’t something you’ll pick up by watching free content or working through a generic course. Genuine understanding of participant behaviour behind price is scarce precisely because so few people who actually have it are willing to teach it properly. That’s exactly why the traders who do learn it – properly, from someone who trades this way themselves – tend to see their reading of the market shift quickly, not over years of trial and error.
I don’t believe in telling people to “be patient” and accept losses as some unavoidable rite of passage. Under the right mentorship, corrections to how you’re reading a chart can happen the same day you make them. I’ve watched it happen repeatedly with people I’ve trained. The years-long struggle most traders go through isn’t a required stage of development – it’s what happens by default when nobody ever shows you what to actually look at.
If you want to build this skill properly and quickly, my Learn to Trade in 5 Days programme is a complete, standalone course built around exactly this kind of professional market reading – not a taster for something bigger, but everything you need to trade one strategy properly, trend reading included. And if you want the full depth of training, my Forex Training Course is suited to new and experienced traders alike, because reading trend correctly is foundational no matter how long you’ve been trading.
Putting It Into Practice
The next time you open a chart, resist the urge to load up a moving average or an ADX line before you’ve even looked at the raw price structure. Start with the swings. Ask yourself honestly whether the highs and lows are extending in one direction, and then ask what that tells you about which participants currently have the upper hand.
Trend identification isn’t a shortcut you apply once and forget. It’s a constant read – one that gets sharper the more you understand what’s actually driving price beneath the surface. That’s the professional thinking I try to instil in every trader I work with, and it’s the difference between reacting to a trend after the fact and recognising it while it’s still forming.